17 Research cycle
![]()
In Chapter 1, you learned about the research process, which includes the research context, data acquisition, data analysis and communication. A different perspective on the research process that highlights the temporal succession of the process steps is the research cycle, represented in an idealised form in Figure 17.1.
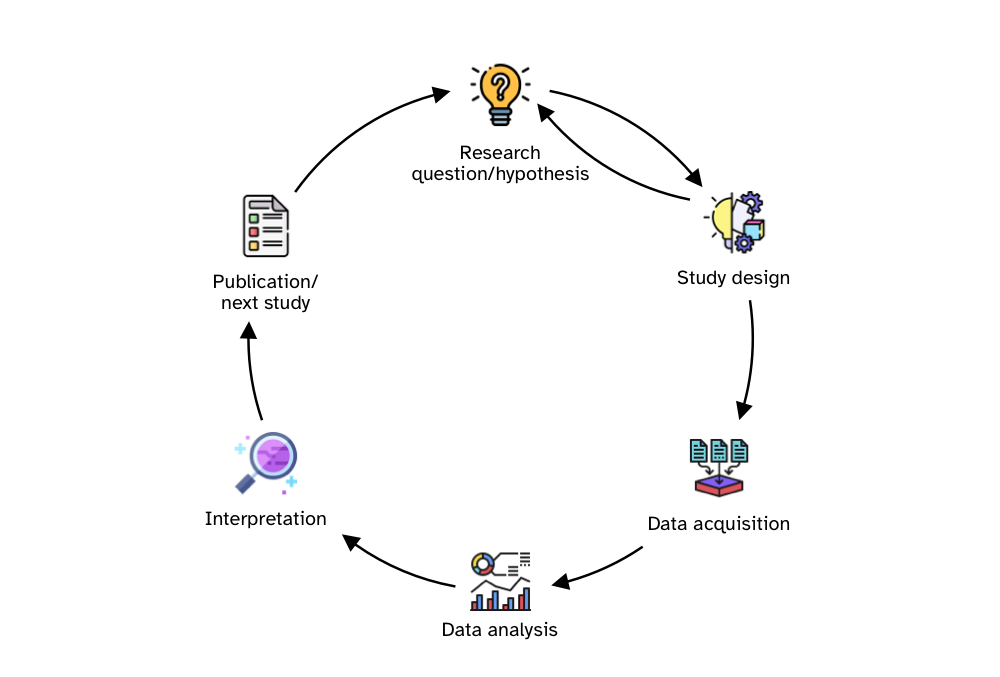
The cycle starts with the development of research questions and hypotheses. This step involves a thorough literature review and the identification of the topic, research problem, goal, questions and, possibly, hypotheses (as described in Chapter 2). Once the research questions and hypotheses have been determined, the researcher proceeds with the design of the study which sets out to answer the research questions and assess the research hypotheses. The study design process includes determining a large number of interconnected aspects, like materials, procedures, data management and data analysis plans, target population, sampling method and so on. At times the study design process reveals shortcomings or unforeseen aspects of the research questions/hypotheses which can be updated accordingly.
Once the study design has been finalised, one proceeds with acquiring data based on the protocols detailed in their plan. After the completion of data acquisition, researchers analyse data and interpret the results in light of the research questions and hypotheses. Finally, the outcomes of the study are published in some form and the next study cycle begins once again.
This sounds all very reasonable, but in reality, the researchers’ practice is quite different. This chapter introduces the concept of “researcher’s degrees of freedom” and describes the so-called Questionable Research Practices (QRPs). We will review literature that shows the grim reality of how common QRPs are. In Chapter 33, you will learn about principles and tools that are designed to help minimise the presence and impact of QRPs in one’s own research.
17.1 Researcher’s degrees of freedom
Data analysis involves many decisions, such as how to operationalise and measure a given phenomenon or behaviour, which data to submit to statistical modelling and which to exclude in the final analysis, or which inferential approach to employ. This “freedom” can be problematic because humans show cognitive biases that can lead to erroneous inferences (Tversky and Kahneman 1974). For example, humans are prone to see coherent patterns even in the absence of them (Brugger 2001), convince themselves of the validity of prior expectations by cherry-picking evidence (aka confirmation bias, “I knew it,” Nickerson 1998), and perceive events as being plausible in hindsight (“I knew it all along,” Fischhoff 1975). In conjunction with an academic incentive system that rewards certain discovery processes more than others (Koole and Lakens 2012; Sterling 1959), we often find ourselves exploring many possible analytic pathways but reporting only a selected few depending on the quality of the narrative that we can achieve with them.
This issue is particularly amplified in fields in which the raw data lend themselves to many possible ways of being measured (Roettger 2019). Combined with a wide variety of conceptual and methodological traditions as well as varying levels of quantitative training across sub-fields, the inherent flexibility of data analysis might lead to a vast plurality of analytic approaches that can itself lead to different scientific conclusions (Roettger, Winter, and Baayen 2019). Analytic flexibility has been widely discussed from a conceptual point of view (Nosek and Lakens 2014; Simmons, Nelson, and Simonsohn 2011; Wagenmakers et al. 2012) and in regard to its application in individual scientific fields (e.g., Charles et al. 2019; Roettger, Winter, and Baayen 2019; Wicherts et al. 2016). This notwithstanding, there are still many unknowns regarding the extent of analytic plurality in practice.
Consequently, a substantial body of published articles likely present overconfident interpretations of data and statistical results based on idiosyncratic analytic strategies (e.g., Gelman and Loken (2014); Simmons, Nelson, and Simonsohn (2011)). These interpretations, and the conclusions that derive from them, are thus associated with an unknown degree of uncertainty (dependent on the strength of evidence provided) and with an unknown degree of generalizability (dependent on the chosen analysis). Moreover, the same data could lead to very different conclusions depending on the analytic path taken by the researcher. However, instead of being critically evaluated, scientific results often remain unchallenged in the publication record.
17.2 Questionable Research Practices
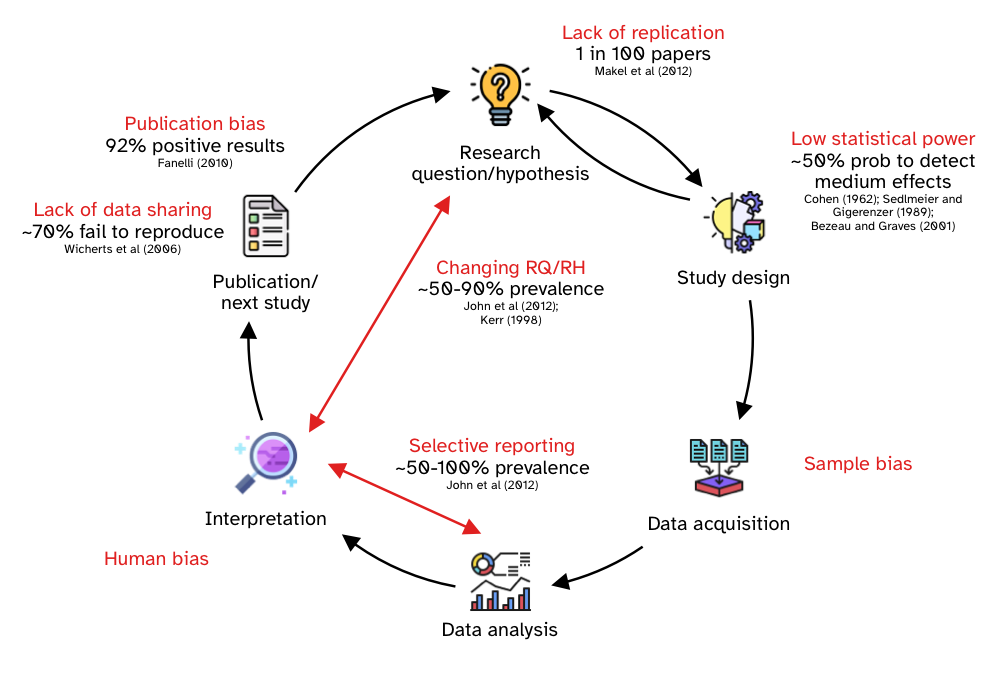
Questionable research practices are practices, whether intentional or not, that undermine the robustness of research (Simmons, Nelson, and Simonsohn 2011; Morin 2015; Flake and Fried 2020). Questionable research practices are practices that negatively affect the research enterprise, but that are employed (most of the time unintentionally) by a surprisingly high number of researchers (John, Loewenstein, and Prelec 2012). For each step in the research cycle, questionable practices are available to researchers. These are part of the researcher’s degrees of freedom, introduced in the previous section. In this section, we will briefly review some of the most common questionable research practices identified in the literature.
Makel, Plucker, and Hegarty (2012) looked at the publication history of 100 psychological journals since 1900. They found that only 1.07% of the papers (that is, 1 in 100 papers) were replications of previous studies. This means that the vast majority of studies are run only once and the field moves on. As Tukey (1969, 84) said, “Confirmation comes from repetition. Any attempt to avoid this statement leads to failure and more probably to destruction”. This lack of replication attempts is problematic, given than we can’t be certain the results obtain from the one study would replicate if the study is run again. While the study in Makel, Plucker, and Hegarty (2012) focused on psychology, Kobrock and Roettger (2023) find that linguistics shows a more dire situation: only 0.08% of experimental articles contains an independent direct replication (1 in 1250).
Another issue that affects modern research regards study design, including aspects related to sample size. Several studies have found that most research employs study designs that grant a 50% probability of being able to find effects of medium size (Cohen 1962; Sedlmeier and Gigerenzer 1992; Bezeau and Graves 2001). Gaeta and Brydges (2020) find a similar scenario in speech, language and hearing research: the majority of studies they screened did not have an adequate sample size to be able to detect medium-sized effects.
In a study about the prevalence of questionable research practices, John, Loewenstein, and Prelec (2012) found that about 50% of the researchers interviewed admitted to selective reporting, i.e. reporting only some of the statistical analyses or studies conducted. Combined with a theoretical admission rate, the authors argue for a 100% rate of selective reporting (in other words, we can expect all published studies to be affected by selective reporting). They also found that about 35% of the researchers admitted to having changed the research question/hypothesis after seeing the results (or “claiming to have predicted an unexpected finding”), also known as HARKing (Hypothesising After the Results are Known, Kerr 1998). Combined with the theoretical admission rate, they estimate an actual rate of 90%.
We will talk more about sharing research data when you will learn about Open Research practices in Chapter 33, but Wicherts et al. (2006) contacted the authors of 141 articles in psychology asking to share the research data with them and a worrying 73% of the authors never shared their data. Bochynska et al. (2023) surveyed 600 linguistic articles and less than 10% of them shared their data as part of the publication.
Publication bias is used to refer to the bias towards publishing “positive” results (i.e. results that indicate the presence of an effect). Fanelli (2010); Fanelli (2012) found that about 80% of published results are positive results across disciplines, while the prevalence of positive results was higher in fields like psychology and economics (about 90%). Of course, the very high prevalence of positive results indicates that a lot of “negative” results (i.e. results that don’t suggest the presence of an effect) are not published, because in a neutral scenario (where researchers propose and test hypotheses, in an iterative process), there should be many more negative results. Ioannidis (2005), for example, shows through computational modelling that a prevalence rate of positive results of 50% or above would be very difficult to obtain and concludes that “most published research findings are false”. Relatedly, Nissen et al. (2016) also use computational modelling to show how false claims can frequently become canonized as fact, in the absence of sufficient negative results. Further to these points, Scheel (2022) stresses that “most psychological research findings are not even wrong”, in that most claims made in the literature are “so critically underspecified that attempts to empirically evaluate them are doomed to failure” (Scheel 2022, 1).