3 Quantitative data analysis
![]()
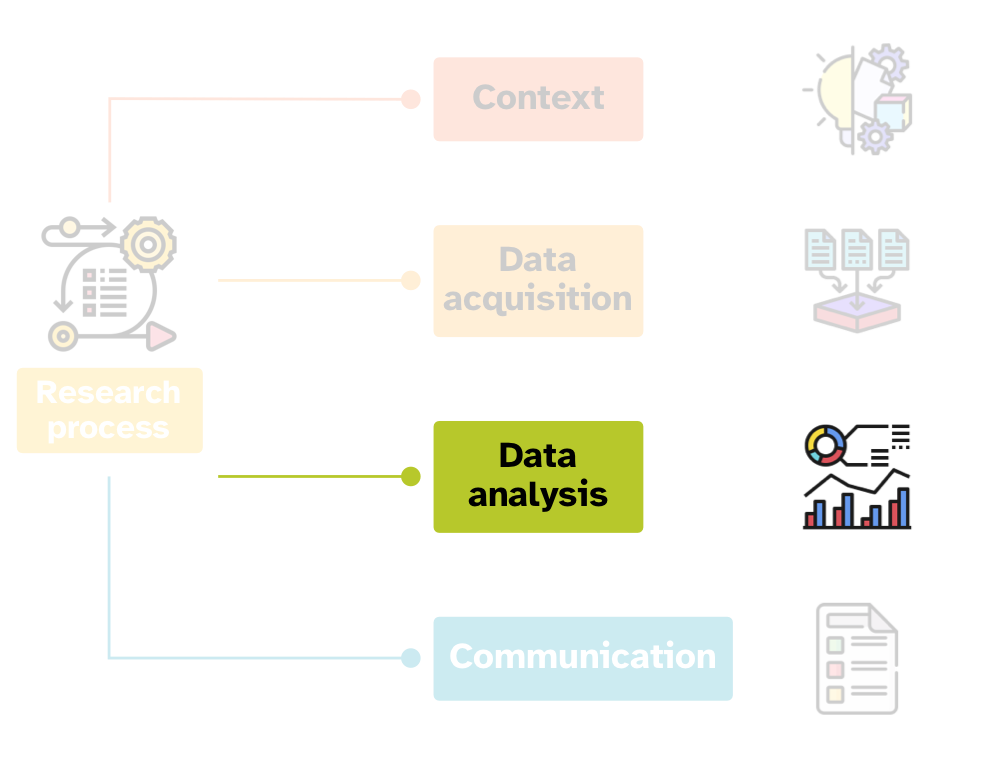
Data analysis is anything that relates to analysing data, whether you collected it yourself or you used pre-existing data.
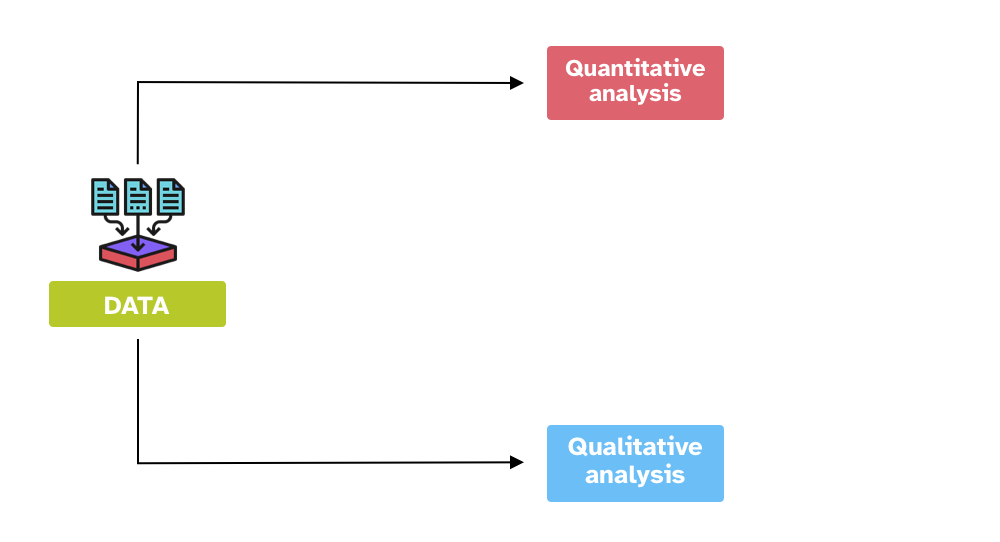
There are two main approaches to data analysis:
Quantitative data analysis is about learning from measured data. Data can be operationalised in many different ways and these determine the type of analyses you can apply.
Qualitative data analysis is about learning from the features and characteristics of the data.
Note that while it is common to talk about “quantitative vs qualitative data” in fact in most cases data can be conceived as both quantitative and qualitative. It is really how we approach the data that can be quantitative and/or qualitative. Moreover, these two approaches to data analysis are not necessarily opposite to each other and there are some aspects of each in each other. This will become clearer at the end of the course this textbook is written for.
This textbook focuses on quantitative data analysis. The rest of this chapter introduces fundamental concepts of quantitative methods.
3.1 Quantitative data analysis
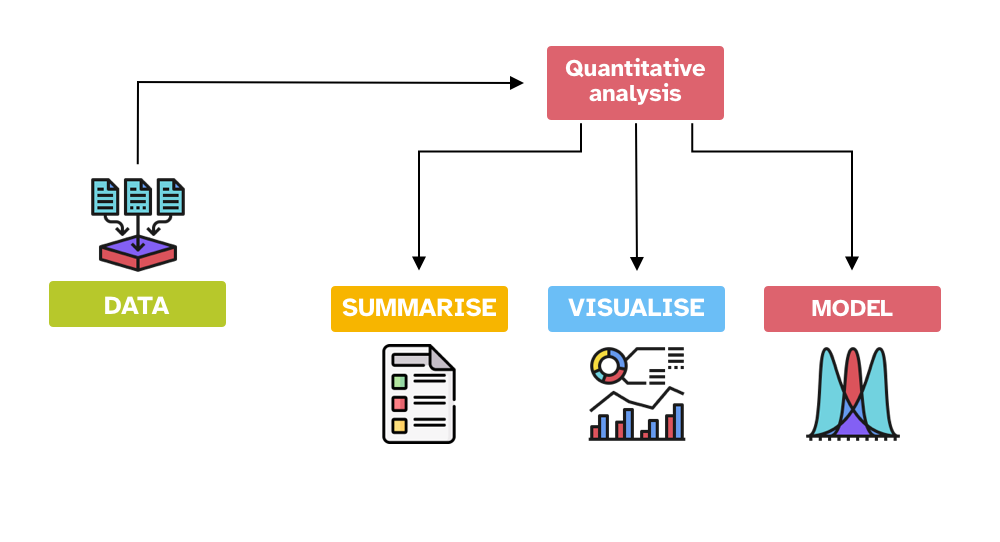
Quantitative analyses are usually comprised of three parts (these are not strictly distinct and the boundaries are sometimes blurred):
Summarise data with summary measures.
Visualise data with plots.
Model data with statistical models.
Summary measures are numbers that represent certain properties of the data: common summary measures are the mean and the standard deviation. You will have frequently seen these in published papers, either in text or as a table. You will learn about summary measures in Chapter 10.
Plots, or graphs, are another common way to summarise data but they are based on visual representation rather than single numbers. As the saying goes, “a picture is worth a thousand words”. The aim of plots is to make explicit certain patterns in the data. Choosing and designing plots that are effective and captivating is more of an art and you will learn the basics and heuristics of good (and bad) plots in Chapter 14.
Statistical models are mathematical representations of patterns and relationship in data. Statistical modelling is a powerful tool to learn from the data or to assess research hypotheses. This textbook introduces you to a specific type of statistical models: regression models. These are highly flexible models that can be used with a variety of data types. You will start learning about statistical models in Chapter 23.
3.2 The computational workflow
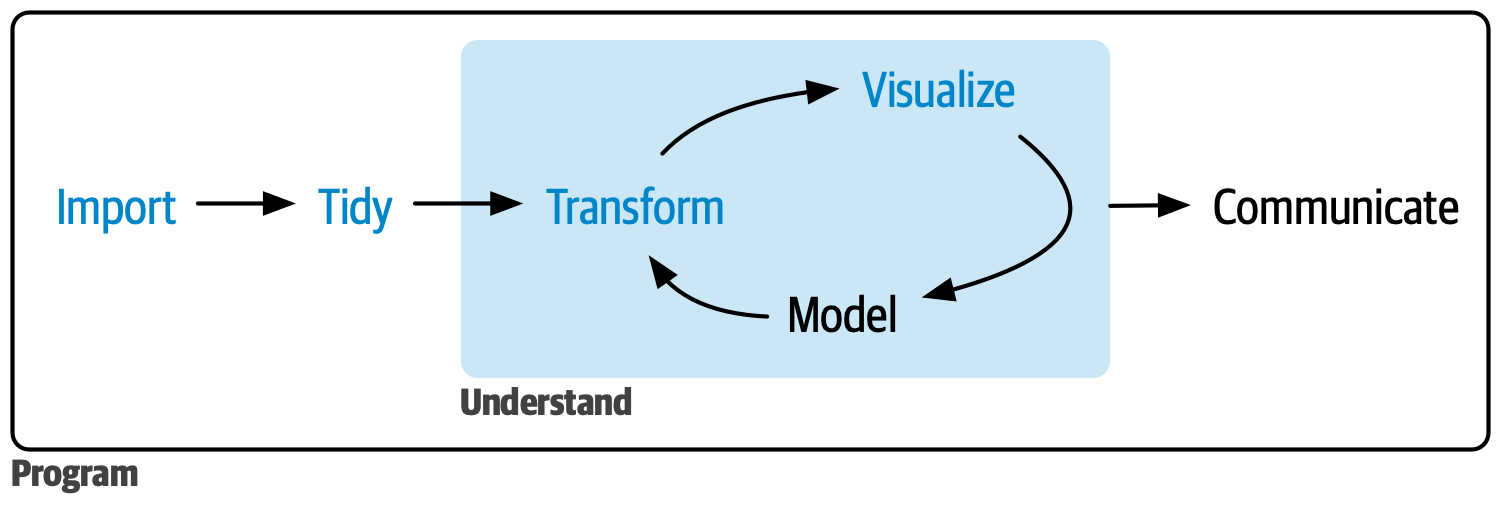
Another way to look at quantitative data analysis is through its computational workflow. Figure 3.1 shows a typical workflow (Wickham, Çetinkaya-Rundel, and Grolemund 2023): you import data, you tidy data up (i.e., you reshape the data so that it is easy to work with), you transform it (i.e., you filter observations, change existing columns or create new ones, obtain summary measures and join data together), you visualise it, you apply statistical models and then you communicate what you learned. Very often, transforming, visualising and modelling data is done iteratively, which is why these steps are shown in a loop in Figure 3.1, and together they form the “understanding” part of the process. Through the transform-visualise-model cycle, you understand things about the data. All of the steps in Figure 3.1 are surrounded by a program: this is “computational programming”, in other words using the computer to execute those steps.
You will learn the basics of how to import (aka read) data in Chapter 9, transform it in Chapter 11 and Chapter 12, visualise it in Chapter 14 and Chapter 15, and model it from Chapter 21 onwards. However, you will find bits from any of these steps in many other chapters, so that you won’t have to learn everything at once.
3.3 Numbers have no meaning
Finally, I should mention a more philosophical aspect of quantitative data analysis. As said above, both qualitative and quantitative approaches are valid and necessary to improve our understanding of things. Crucially, even a very complex quantitative analysis will always contain some qualitative aspects to it.
There’s a lot of wisdom in that quote. Numbers do not mean anything by themselves. We need to interpret numbers, “imbue them with meaning”, based on many aspects of research and beyond, including our own identity and positionality (Jafar 2018; Darwin Holmes 2020). Gelman and Hennig (2017) highlight how we should move away from concepts of “objectivity” and “subjectivity” as applied to statistics, and instead propose a broader collection of “virtues”. They say: “Instead of debating over whether a given statistical method is subjective or objective (or normatively debating the relative merits of subjectivity and objectivity in statistical practice), we can recognize attributes such as transparency and acknowledgement of multiple perspectives as complementary” (Gelman and Hennig 2017, 973). The philosophical backdrop of this textbook (and its author) very much embody this sentiment.