7 Modelling electroglottographic data with wavegrams and generalised additive mixed models [Paper IV]
Coretta, Stefano. 2020. Modelling electroglottographic data with wavegrams and generalised additive mixed models. OFS Preprints. DOI: https://doi.org/10.31219/osf.io/m623d.
Abstract
While electroglottography is a practical and safe technique for obtaining articulatory data on voicing, statistical analysis of the signal it returns poses a few challenges given the highly dimensional nature of the signal. The wavegram has been proposed as a visualisation method which overcomes the limitations of reducing the complex electroglottographic signal to a single measure like the contact quotient. This paper introduces a method for modelling dynamic electroglottographic data based on the wavegram using generalised additive models (GAMs). Results from a pilot study which assesses the reliability of this method by comparing sustained modal and breathy phonation are presented. The applicability of wavegram GAMs is exemplified with the discussion of an exploratory study on the dynamical properties of voicing in vowels followed by voiceless and voiced stops in Italian and Polish. Increasing average glottal opening can be observed in the second half of vowels, although the timing and magnitude of the increase differs depending on the voicing of the following stop and on the language. Insights on the diachronic development of pre-aspiration based on these results are also discussed.
7.1 Introduction
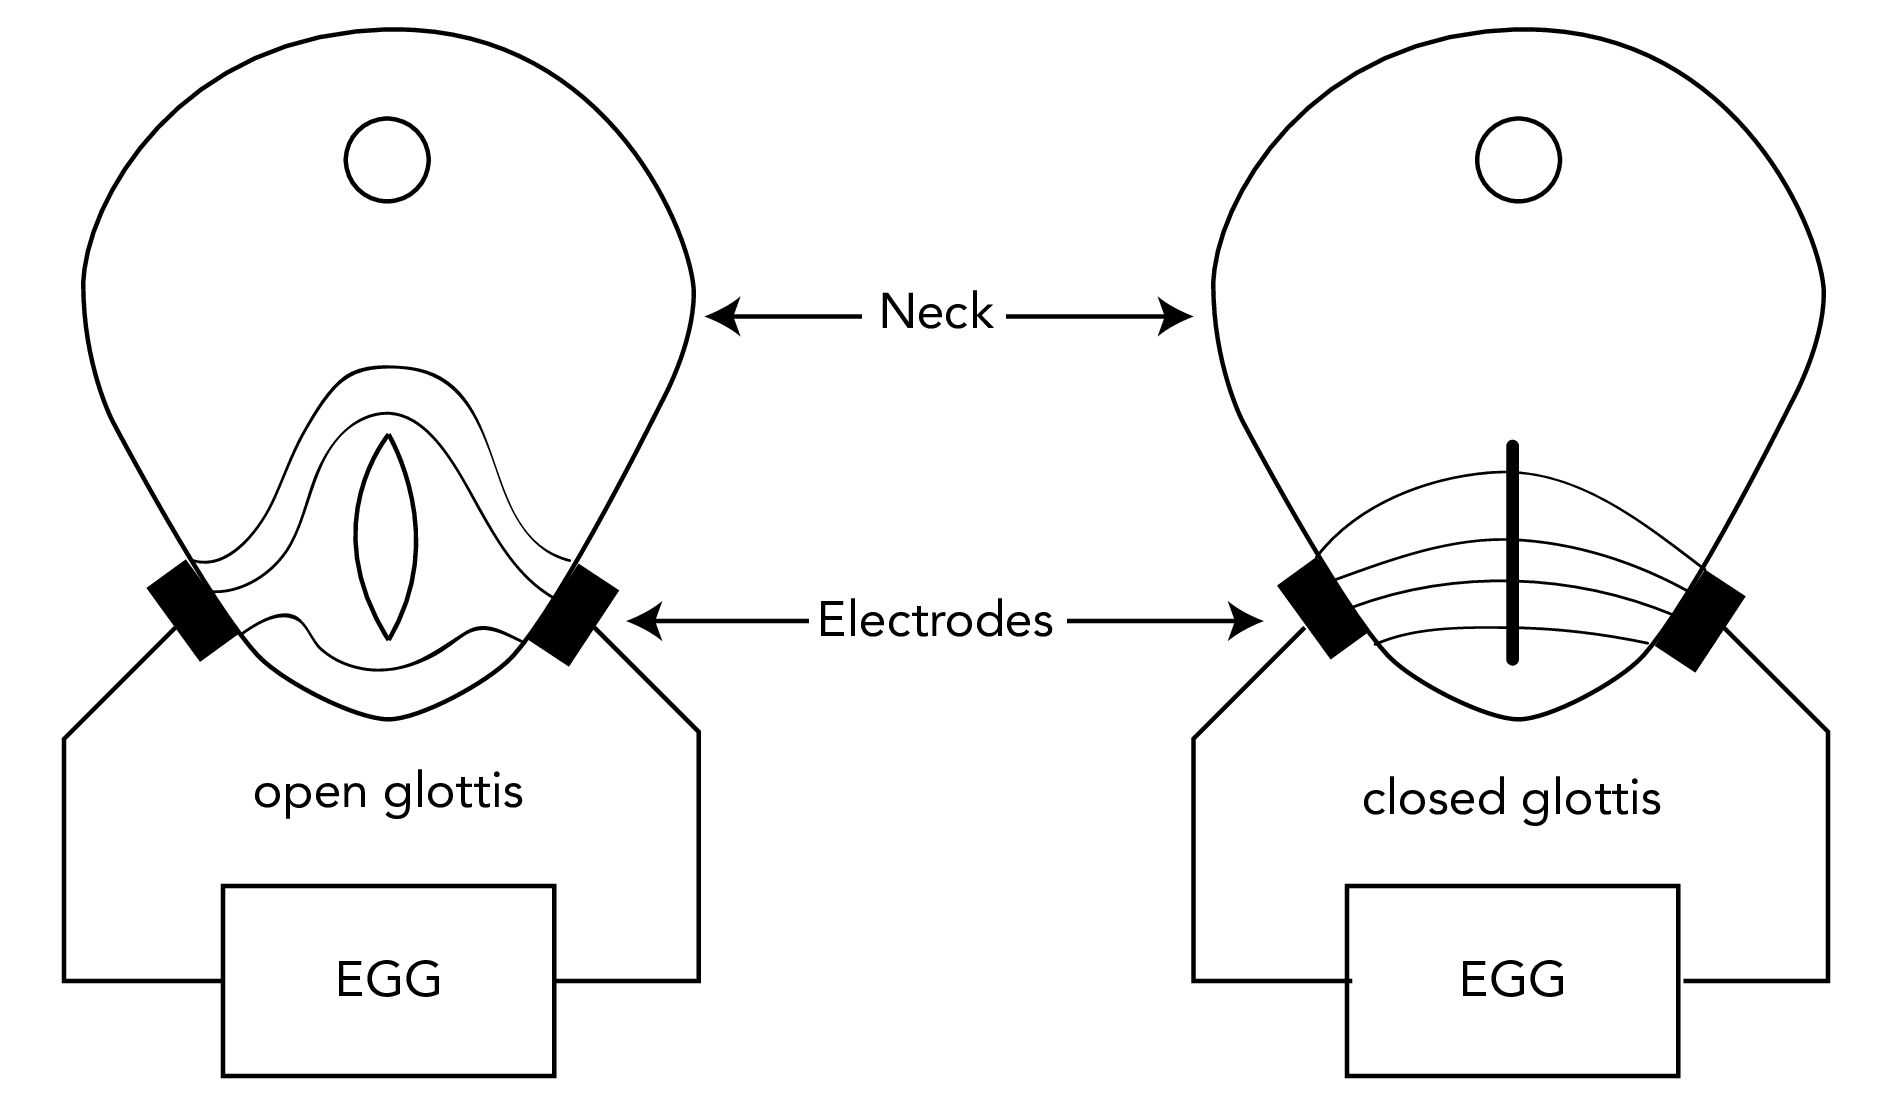
Figure 7.1: A schematics of the electroglottograph. A transverse section of the neck is shown with open glottis (on the left) and closed glottis (on the right). The electric field passing through the neck is represented by lines. When the vocal folds are apart, the opening distorts the electric field and impedance increases.
The location of the vocal folds within the oral tract makes investigation of glottal activity difficult. Direct observation of the the larynx via invasive methods like laryngoscopy has the practical drawbacks of being of great discomfort to the participant and of requiring medical expertise to be performed. Electroglottography, on the other hand, is a non-invasive and safe technique which enables researchers to obtain an indirect account of glottal activity. However, the complexity of the electroglottographic signal and the imperfect mapping between the signal and the laryngeal activity it measures pose some analytical challenges deriving from the reduction of the signal to a single measure. The wavegram technique has been proposed as a visualisation form of electroglottographic data which maintains the multi-dimensionality of the signal (Herbst, Fitch & Švec 2010). In this paper, generalised additive modelling (Hastie & Tibshirani 1986) is proposed as a means to statistically investigate glottal activity as derived from wavegrams.
Electroglottography, or EGG (Fabre 1957), is a technique that measures the degree of contact between the vocal folds (the Vocal Folds Contact Area, VFCA). A high frequency low voltage electrical current is sent through two electrodes which are in contact with the surface of the neck, one on each side of the thyroid cartilage (Figure 7.1). Impedance of this current is modulated by the VFCA, and greater vocal folds contact creates less impedance. The amplitude of the current is inversely correlated with VFCA and impedance, so that higher amplitude values indicate a greater contact area (Titze 1990). The EGG unit registers the current impedance and converts it to relative amplitude values. The time-developing amplitude signal thus provides us with information on the changes in VFCA, i.e. on properties of vocal folds vibration (voicing).
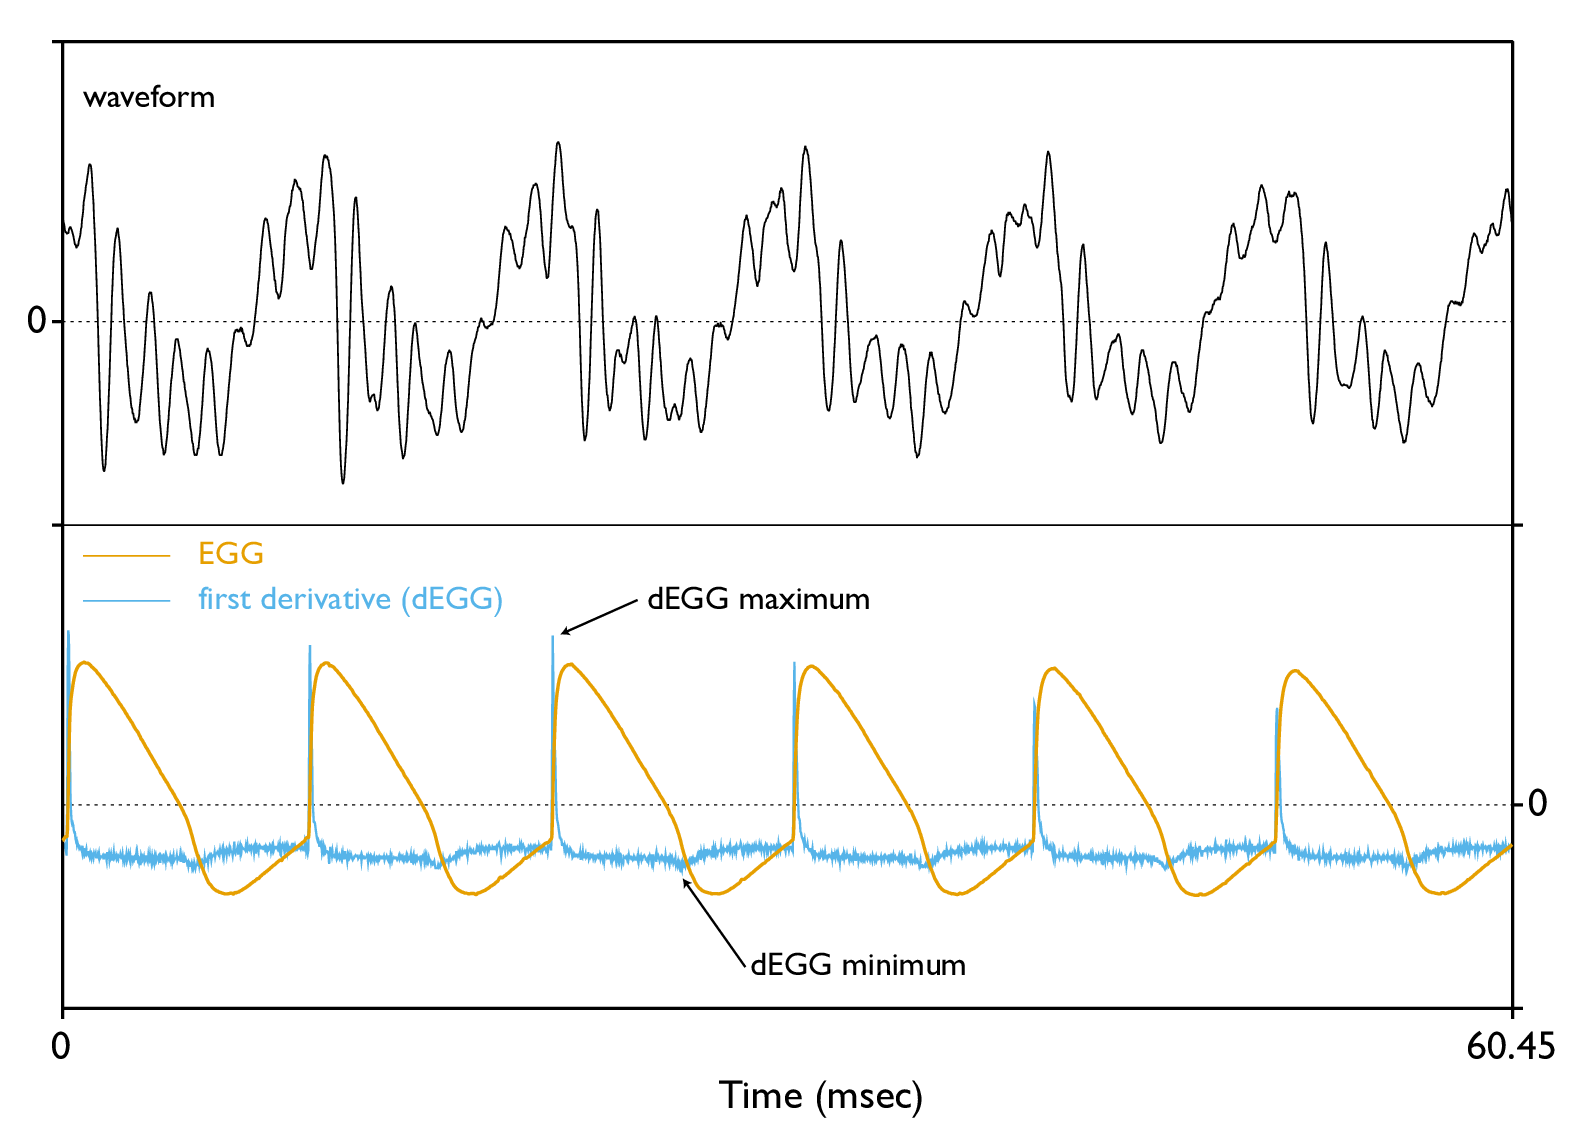
Figure 7.2: The electroglottographic signal (EGG) with corresponding first derivative (dEGG).
A glottal cycle can be divided in two phases (Childers & Krishnamurthy 1985; Hampala et al. 2016): (a) a contacting phase, in which the vocal folds are approaching each other, and (b) a de-contacting phase, in which the vocal folds move apart from each other. Transversal to this two-phase representation, the glottal cycle can be described in terms of whether the glottis is closed or not. According to this classification, the cycle can be divided into (1) a closed phase, in which the glottis is completely closed and glottal flow is 0 (in some contexts this phase could be absent, like in breathy voicing), and (2) an open phase, in which there is no complete contact between the vocal folds. The timing of these phases can be approximated from the EGG signal, as demonstrated by both experimental and modelling work (Hampala et al. 2016). An example EGG signal is provided in Figure 7.2.
Two important landmarks of glottal movement are the closing instant (the timepoint of glottal complete closure) and the opening instant (the moment in which the glottis first opens). These points delimit the open and closed phases of a glottal cycle. The ratio of the closed phase relative to the total cycle duration, the closed quotient, has been used as an index of phonation type (Scherer & Titze 1987). Modal voice has higher closed quotient values than breathy voice, and lower values than creaky voice. One method for the detection of the closing and opening instants is based on the first derivative of the EGG signal (the dEGG, see Figure 7.2). Herbst et al. (2017), however, showed that this method returns values that are just a surrogate of the actual articulatory movements, due to the complex anatomy of the vocal folds, and that there are no clear contacting and decontact instants, but rather intervals. Herbst et al. (2017) call this EGG-based closed quotient the “contact quotient” and recommend to keep it distinct from the closed quotient obtained from direct observation of the vocal folds.
As an alternative to the contact quotient, Herbst, Fitch & Švec (2010) propose the wavegram, a visualisation method which does not reduce the EGG signal to a single value and thus suffers less from the limitations of the contact quotient. The wavegram incorporates information from the whole signal to obtain an image of vocal folds activity. A wavegram is a 3D representation of the EGG signal developing in time. Its structure is similar to that of a classical phonetic spectrogram. The x-axis indicates the temporal sequence of individual glottal cycles. The y-axis represents the time within each glottal cycle, normalised between 0 and 1. Finally, the normalised amplitude of the signal corresponds to different colour intensities. Differences in intensity along the x-axis indicate changes in glottal activity. The procedure for constructing a wavegram is given in Figure 7.3. A wavegram can be produced for the EGG signal and for any of its transformations, like the dEGG.
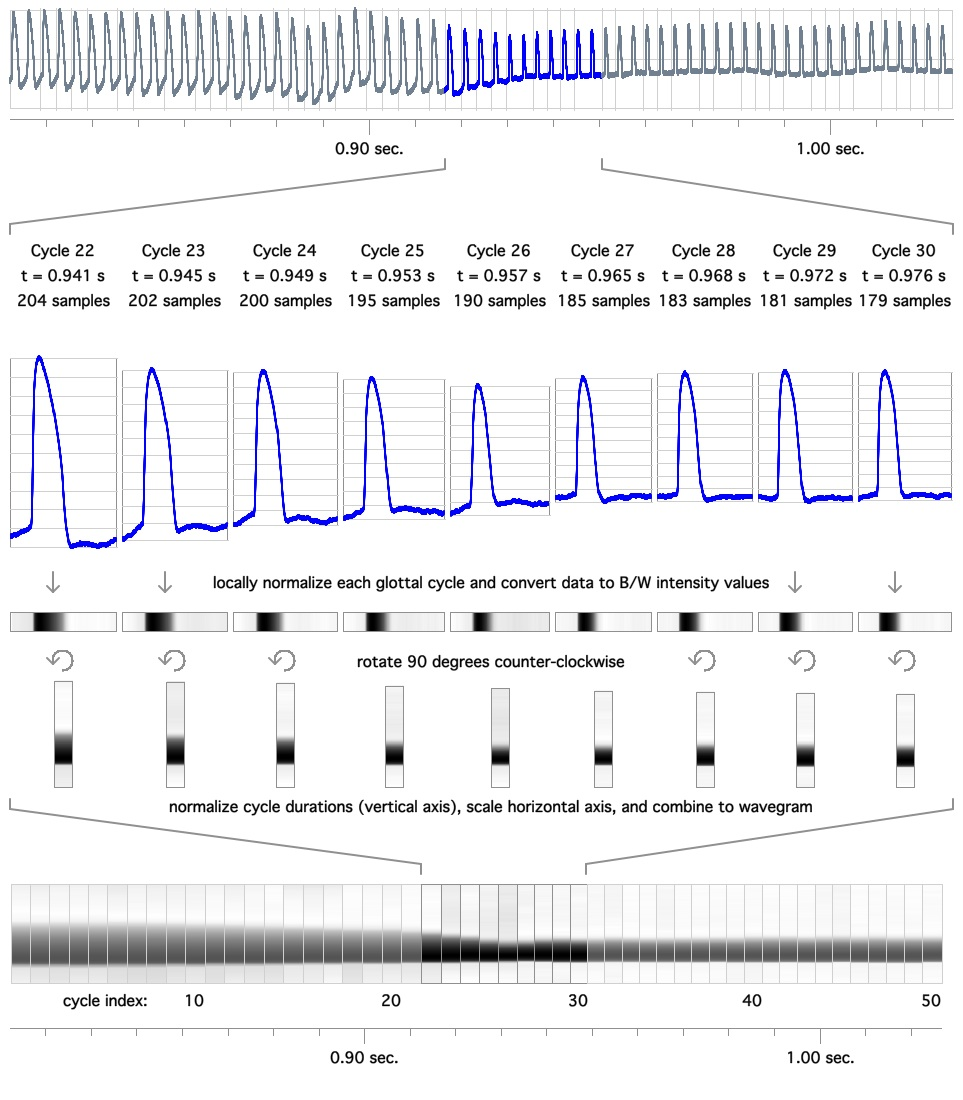
Figure 7.3: The wavegram. Created by Christian T. Herbst under a CC BY-SA 3.0 license.
The wavegram method was originally intended for a qualitative analysis based on visual inspection. However, wavegram data can be modelled using generalised additive models (GAMs, Hastie & Tibshirani 1986; Zuur 2012; Wood 2017). GAMs are a family of generalised models which can fit non-linear effects by additive combinations of smoothing splines. The flexibility of GAMs allows researchers to generate a fitted wavegram based on data from multiple repetitions of a single speaker and from multiple speakers. Random effects can also be included to account for idiosyncratic differences. Moreover, the potential for overfitting is reduced by a smoothing penalty parameter, which constraints the maximum number of basis functions used to construct the smoothing splines. This paper introduces wavegram GAMs as a way to quantitatively assess wavegram data. First, 7.2 presents results from a pilot study which informally evaluates the reliability of the proposed method. 7.3 illustrates how to conduct a dynamical wavegram GAM analysis of dEGG data through a practical example in which the wavegrams of vowels followed by voiceless and voiced stops in Italian and Polish are compared. This analysis indicates the presence of a pattern of glottal spreading in the second half of vowels followed by voiceless stops and of cross-linguistic differences. Insights on the diachronic emergence of pre-aspiration based on these results are discussed. Finally, 7.4 concludes and discusses the limitations of the current implementation of the method and future directions. The data [Coretta (2017); coretta2018m] and analysis scripts of this paper (https://osf.io/3w8gh/) can be found on the Open Science Framework.
7.2 Pilot study
Synchronised audio and EGG data were obtained from 5 trained phoneticians, who were asked to produce sustained tokens of /a/ with modal and breathy voice.
The data was collected using a Glottal Enterprises EG2-PCX2 electroglottograph and a Movo LV4-O2 Lavalier microphone, at a sample rate of 44100 Hz (16-bit).
The acquisition of the signals was controlled with Audacity running on a MacBook Pro (Retina, 13-inch, Mid 2014).
The placement of the electrodes strap was checked with the height indicator on the EGG unit.
Each participant uttered 10 consecutive tokens of a sustained /a/ in modal voice, followed by 10 tokens of a sustained breathy /a/.
All subsequent data processing was performed in Praat (Boersma & Weenink 2018).
The onset and offset of each token were detected with an automatic procedure which finds voiced and unvoiced intervals (To TextGrid (vuv)).
The dEGG wavegram data was extracted from the first 8 glottal cycles of a 500 ms window, centred around the mid-point of each token.
A glottal cycle was arbitrarily defined as the interval between two consecutive EGG minima (see Herbst, Fitch & Švec 2010 for an alternative algorithm).
From each glottal cycle, the relative amplitude of the dEGG signal was extracted every 10 samples.
The reader is referred to Coretta (2017) for the documentation of the algorithms and the research data.
A generalised additive mixed model (GAMM) was fitted to the data to statistically assess differences in vocal fold activity between modal and breathy voicing (see Sóskuthy 2017; and Wieling 2018 for a practical introduction to fitting GAMs in R). The following terms were included: the amplitude of the dEGG signal as the outcome variable, an interaction factor with language and phonation as a parametric term, a smooth over the glottal cycle index to model average changes of the dEGG signal across glottal cycles, and a smooth over the normalised time of the sample within the glottal cycle (as the proportion of the time relative to the duration of the glottal cycle) to model average changes of the dEGG signal within the glottal cycle; two difference smooths over normalised time of the glottal cycle onset and normalised sample time using a by-variable with the phonation factor; a tensor product interaction between normalised cycle time and normalised sample time to model changes of glottal activity through time, and the same tensor product interaction with a language/phonation by-variable to model phonation-driven differences in changes of glottal activity. Finally, inter-speaker differences were modelled with a by-speaker factor smooth over normalised cycle time. A first-order autoregressive (AR1) model was included to deal with the relatively high auto-correlation in the residuals.
Figure 7.4 shows the modelled wavegrams of modal and breathy tokens. Since the tokens were produced with sustained phonation, no appreciable change within each wavegram can be observed. However, the comparison of the wavegram of modal voice with that of breathy voice reveals differences between the two phonation types. As a general trend, the dEGG maximum and dEGG minimum are achieved later within the glottal cycle in breathy voicing relative to modal voicing. Moreover, differences in velocity of closing and opening movements of the vocal folds are signalled by the relative widths of the purple-coloured bands (around the dEGG maximum) and the green-coloured bands (around the dEGG minimum). While in modal voicing the green band is wider, the purple band is in breathy voicing, indicating that the velocity into and out of the beginning of the closed phase is slower in breathy voicing. According to the approximate significance of the smooth terms, phonation has an effect on the shape of the wavegram as expected (F(14.681) = 3.187, Ref.EDF = 19.027, p < 0.001).
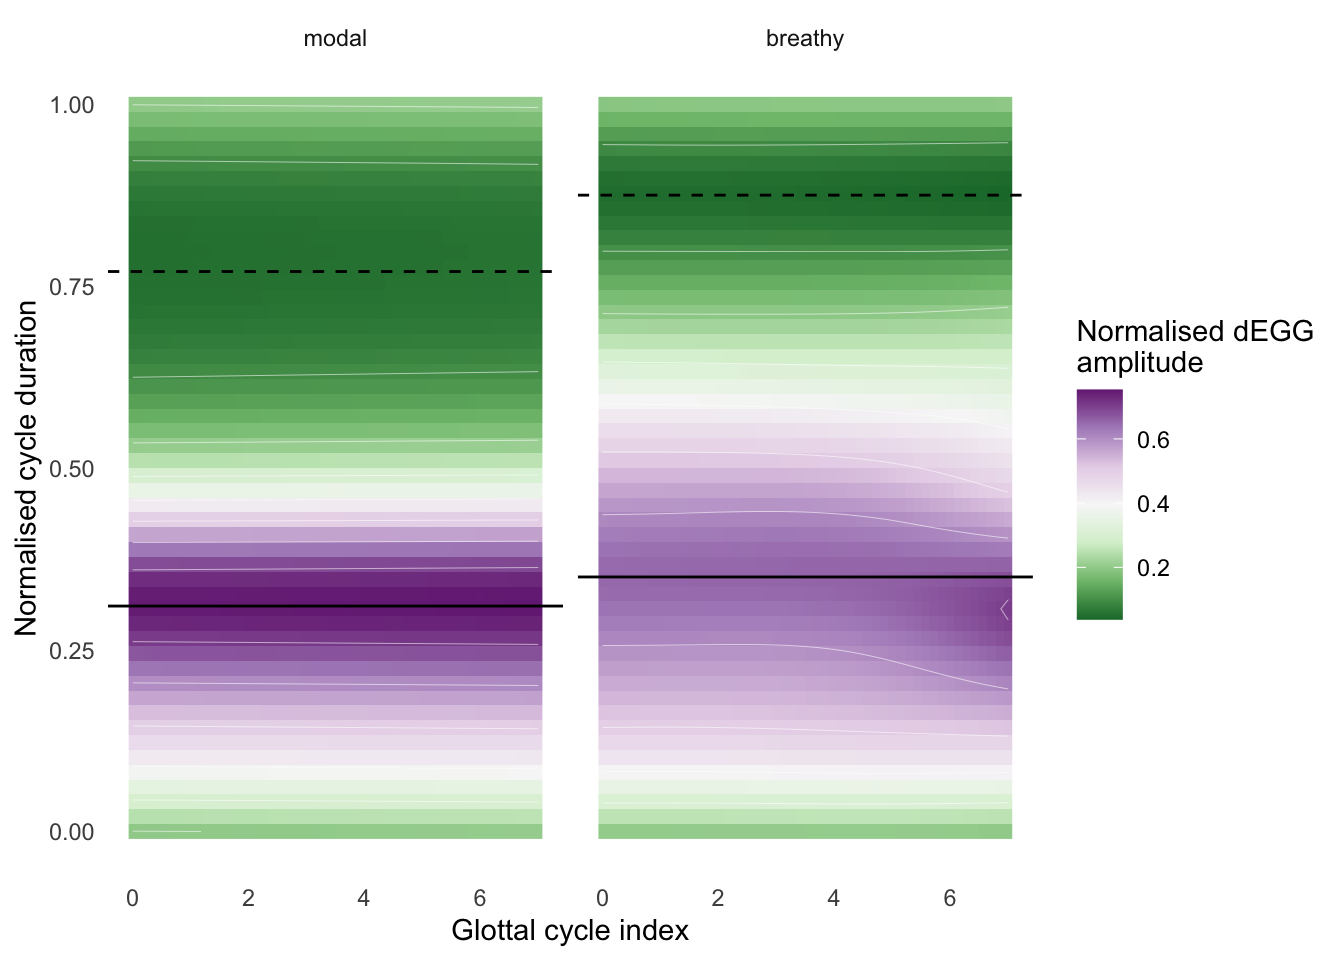
Figure 7.4: Fitted wavegram of modal and breathy phonation (Section 2). The horizontal lines represent the dEGG maximum (solid line) and minimum (dashed line).
7.3 Wavegram GAM analysis of vowels followed by voiceless vs voiced stops
This section further illustrates the use of wavegram GAMs by discussing a dynamic analysis of changes in vocal folds activity during the production of vowels followed by voiceless vs voiced stops in Italian and Polish. EGG data was obtained from 9 Italian speakers and 6 Polish speakers. A detailed description of the experimental design is given in Coretta (2019d). Trochaic words with the form CVCV were used, where C = /p/, V = /a, o, u/, C = /t, d, k, g/, and V = V (e.g. /pata/, /pada/, /poto/, etc.), embedded in the frame sentences Dico X lentamente ‘I say X slowly’ in Italian, and Mówię X teraz ‘I say X now’ in Polish. The participants repeated each of the twelve sentence stimuli six times. Processing and analysis of the EGG data were the same as with the pilot study (7.2), with the exception that data was extracted from every glottal cycle within the whole duration of the first vowel of the word stimuli. The vocalic onset and offset were identified as the appearance and disappearance of higher formant structure respectively (Machač & Skarnitzl 2009). Vowel duration was then normalised between 0 and 1 for analysis. The data of this study is available on the Open Science Framework (Coretta 2018a).
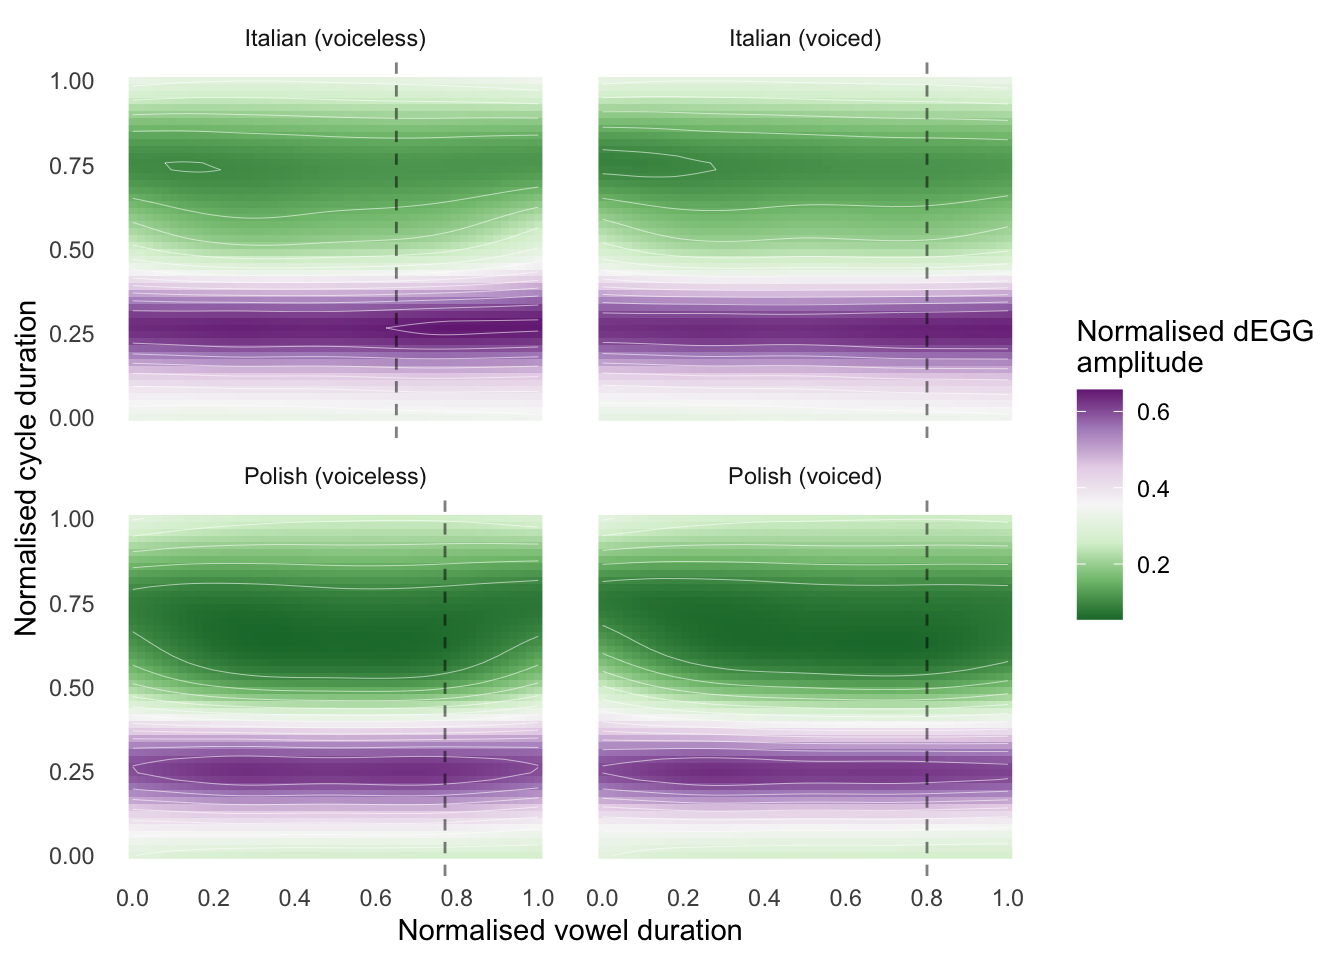
Figure 7.5: Fitted wavegram of vowels followed by voiceless and voiced stops in Italian and Polish (Section 3).
The same GAM specification as in the pilot study was used to model changes in glottal activity. Normalised vowel duration was used instead of glottal cycle index. Figure 7.5 shows the modelled wavegrams of vowels followed by voiceless (left) and voiced stops (right), in Italian (top) and Polish (bottom). The pilot study showed that a widening of the wavegram dEGG maximum band (purple) with concomitant shrinkage of the dEGG minimum band (green) signals greater glottal opening. The change in band width corresponds to changes in velocity of the execution of the contacting and decontacting movements. An interesting aspect of the modelled glottal activity concerns the first half of the vowels. The change in the wavegram indicates a process of decreasing glottal opening (from a breathier to a more modal phonation). The greater glottal spread observed at vowel onset could be related to the residual glottal spread of the preceding voiceless stop /p/. This means that the phonation at vowel onset is breathier and becomes more modal during the production of the vowel, stabilising itself at about 20% of the vowel duration.
Focussing now on the second half of the vowel, the wavegrams in Figure 7.5 show a pattern that is symmetrical to that observed in the first half. Namely, glottal opening increases towards the end of the vowel (also see Halle, Stevens & Oppenheim 1967). The magnitude and timing of the change, however, differs in the voiceless and voiced contexts. The change is greater and is implemented earlier in vowels followed by voiceless stops (left panels) than those followed by voiced stops (right panels). The earlier and greater glottal spreading in vowels followed by voiceless stops could be implemented in anticipation of the open glottis required in the production of voiceless stops as a mechanism to cease/attenuate vocal fold vibration. In the case of voiced stops, Halle, Stevens & Oppenheim (1967) propose that increased glottal width can facilitate voicing while the oral tract is constricted (cf. Westbury 1983), who rather argues that decreased glottal width favours voicing).
The wavegrams of vowels followed by voiceless stops also suggest an effect of language (the GAM terms with a by-language factor return p-values less than 0.001). The change in activity before voiceless stops is initiated earlier in Italian (at around 65% into the vowel) than in Polish (at about 80%). The approximate time of the change onset is represented by the vertical dashed lines in Figure 7.5. On the other hand, activity in vowels followed by voiced stops is similar in the two languages.
The observed greater increase in glottal opening during the production of vowels followed by voiceless stops in Italian is compatible with the reported presence of pre-aspiration (breathy or voiceless) in Italian geminate stops (Nı́ Chasaide & Gobl 1993; Stevens & Hajek 2004a; Stevens & Hajek 2004b; Stevens & Hajek 2010; Stevens 2010; Stevens & Reubold 2014). Increased glottal spreading during vocal fold vibration can be interpreted as a precursor of voiceless pre-aspiration. An enough opened glottis can generate enough glottal airflow so as to equalise sub-glottal and supra-glottal pressure, at which point vocal fold vibration cannot be supported any longer (Berg 1958; Rothenberg 1967; Ohala 2011). The outcome is voiceless glottal frication, or, in other words, voiceless pre-aspiration.
The patterns of glottal spreading observed here fit with proposed mechanisms of emergence of voiceless pre-aspiration or lack thereof. Pre-aspiration (whether normative or not), now argued to be more common than previously thought (Helgason 2002), is found in several Nordic languages (Helgason 1999; Helgason 2002), English (Gordeeva & Scobbie 2007; Nance & Stuart-Smith 2013; Hejná 2015), and, as mentioned above, Italian, among others. An interesting question is how glottal spreading in vowels in the context of voiceless stops can lead to the emergence of voiceless pre-aspiration in some cases and not in others.
Nı́ Chasaide (1985) argues that pre-aspiration develops as a means to enhance discriminability in geminate stops by increasing their overall duration. Under this account, closure shortening is a later development, rather than the cause of the emergence of pre-aspiration. Stevens, Keyser & Kawasaki (2014) present further experimental evidence that the duration of pre-aspiration and that of closure are not correlated in Italian. In other words, pre-aspiration and the closure shortening process are independent. In agreement with Ní Chasaide’s hypothesis, the presence of pre-aspiration increases the total duration of the VC sequence. Pre-closure glottal spreading can thus lead to the emergence of voiceless pre-aspiration, which can in turn be enhanced by delaying the onset of stop closure.
Lisker (1974) proposes that the laryngeal gesture of glottal spreading can determine the onset of the stop closure. While some varieties of English have been reported to show pre-aspiration, others lack it. Lisker argues that stop closure in voiceless stops occurs not long after the spreading gesture is initiated in order to avoid the emergence of voiceless pre-aspiration. The onset of the closure would be temporally attracted towards the time of glottal opening onset. Speculatively, this could be one of the mechanisms responsible for longer closure durations of voiceless stops relative to that of voiced stops (Lisker 1957; Umeda 1977; Summers 1987; Davis & Summers 1989; Jong 1991), other things being equal.
To summarise, glottal spreading, which is a typical feature of the production of voiceless stops, is initiated during the articulation of the vowel preceding the stop. If the degree of spreading surpasses a particular threshold, soon enough a percept of breathy phonation can arise. At this point, two possible scenarios can be envisaged. According to one pathway, breathiness can lead to voiceless pre-aspiration and subsequent enhancement by closure shortening. In such case, pre-aspiration could ultimately develop into normative pre-aspiration like that found in Icelandic. In the alternative scenario, on the other hand, pre-aspiration is prevented from arising. This can be achieved by shifting the timing of the stop closure towards the onset of the glottal spreading gesture, while keeping the timing of the latter unchanged. As a consequence, stop closure duration is increased, resulting in the known pattern of the differential closure durations of voiceless vs voiced stops.
7.4 Conclusion
This paper introduced a method for modelling glottal activity as obtained from wavegram data (Herbst, Fitch & Švec 2010) using generalised additive (mixed) models (Hastie & Tibshirani 1986; Zuur 2012; Wood 2017). A pilot study of the wavegram GAM method showed that the modelled wavegrams are affected by the global changes in glottal activity depending on the phonation mode of voicing. In particular, the ability of the model to distinguish between modal and breathy voicing was tested, and the results indicated that breathy voicing corresponds to delayed dEGG maxima and minima within the glottal cycle and decreased velocities of the contacting phase (with concomitant increased velocity of the decontacting phase). Building on the results of the pilot study, a second study was run to investigate glottal activity in vowels followed by either a voiceless or a voiced stop in Italian and Polish. The results suggest a change of glottal activity during the second half of the vowel in anticipation of the glottal configuration of the following stop (in accordance with Halle, Stevens & Oppenheim 1967). The change corresponds to increasing glottal width in both contexts. However the increase is greater and implemented earlier in the voiceless than in the voiced context.
Moreover, the change in glottal activity in vowels followed by voiceless stops starts earlier in Italian than in Polish. It was argued that the earlier and grater increase in glottal width in Italian is compatible with reports of pre-aspiration in some varieties of the language (Nı́ Chasaide & Gobl 1993; Stevens & Reubold 2014). It was further speculated that once an appreciable degree of glottal spreading is implemented during the vowel, either spreading can result in voiceless pre-aspiration with subsequent stop closure shortening, or voiceless pre-aspiration can be avoided by anticipating oral closure while keeping the glottal gesture (with the consequence of increased closure duration).
A limitation of the proposed wavegram GAM analysis is that, while the model can statistically assess global differences in the wavegram, more localised variation still needs to be assessed qualitatively. For example, while the modelled wavegrams show differences in timing of change in glottal activity, there is no straightforward way of obtaining a unique and robust measure of such timing, and statements about this differences rely on visual inspection of the modelled wavegram. A wavegram GAM analysis, however, is still useful in providing a method to model data from multiple repetitions and multiple speakers in a flexible way. Future work will have to investigate different phonation types (like creaky voice) and phonetic contexts. Moreover, further tests should be conducted to assess the reliability of the method. Finally, ways to obtain quantitative data on timing and degree of changes in glottal activity will be necessary to extend the applicability of the method.