The package speakr allows the user to run a Praat script from within R, optionally passing parameters to the script if a form is used. In combination with rmarkdown::render(), it is possible to generate dynamic reports which include phonetic analyses.
Load the package with:
Run a Praat script
To run a Praat script, use the function praat_run(). The
first argument of the function is the path to the script.
For example:
script <- system.file("extdata", "play-greetings.praat", package = "speakr")

praat_run(script)
If the script has side effects, like creating new files or editing existing ones, these effects will take place.
File output
If the script logs text (like a set of acoustic measurements) to a
file (with writeFile[Line] and
appendFile[Line]), the file is created in the directory
specified in the script, and nothing is returned in R. To load the
results file in R, just read it in as you would with any other
dataset.
The following runs a script that gets formant values and outputs a file with the formant measurements in your home folder.
script <- system.file("extdata", "get-formants.praat", package = "speakr")

praat_run(script)
Praat Info window output
If, on the other hand, the script logs output to the Info window
(with writeInfo[Line] and appendInfo[Line]),
the output will be sent to the R console.
script <- system.file("extdata", "get-formants-capt.praat", package = "speakr")

# Output to R console
praat_run(script)
#> vowel,F1,F2,F3 a,784.4671170665314,1390.927070235929,2433.2403445805335 e,417.00791908249613,2042.453249988405,2423.8583300060627 i,259.0985814360339,2231.740765785137,2819.218714861659 o,562.2955245317842,854.5311682738487,2463.26727657427 u,434.4420321283883,1331.362161871936,2815.9876831692327You can use capture = TRUE in praat_run()
to capture the output and pass it to an R variable. The output will be a
character string.
#> vowel,F1,F2,F3 a,784.4671170665314,1390.927070235929,2433.2403445805335 e,417.00791908249613,2042.453249988405,2423.8583300060627 i,259.0985814360339,2231.740765785137,2819.218714861659 o,562.2955245317842,854.5311682738487,2463.26727657427 u,434.4420321283883,1331.362161871936,2815.9876831692327Of course, you can redirect the captured output using the pipe
|>, for example to read the output as a tibble.
# Output to R tibble
formants <- praat_run(script, capture = TRUE) |>
  read_csv()
class(formants)
glimpse(formants)
#> Rows: 5 Columns: 4
#> ── Column specification ────────────────────────────────────────────────────────
#> Delimiter: ","
#> chr (1): vowel
#> dbl (3): F1, F2, F3
#>
#> ℹ Use `spec()` to retrieve the full column specification for this data.
#> ℹ Specify the column types or set `show_col_types = FALSE` to quiet this message.
#> [1] "spec_tbl_df" "tbl_df" "tbl" "data.frame"
#> Rows: 5
#> Columns: 4
#> $ vowel <chr> "a", "e", "i", "o", "u"
#> $ F1 <dbl> 784.4671, 417.0079, 259.0986, 562.2955, 434.4420
#> $ F2 <dbl> 1390.9271, 2042.4532, 2231.7408, 854.5312, 1331.3622
#> $ F3 <dbl> 2433.240, 2423.858, 2819.219, 2463.267, 2815.988Script arguments using Praat forms
It is possible to pass arguments to the script from R, using Praat
forms in the script. The following example runs the script
get-formants-args.praat, which requires two arguments: unit
(a string, either "Hertz" or "Bark") and
window size (a number). Multiple arguments can be specified in
praat_run(), in the order in which they appear in the
form. These arguments will be passed to the
form in the script.
script <- system.file("extdata", "get-formants-args.praat", package = "speakr")

unit = "Bark"
window = 0.02

f_bark <- praat_run(script, unit, window, capture = TRUE) |>
  read_csv()
attr(f_bark, "args") <- list(unit = unit, window = window)
#> Rows: 5 Columns: 4
#> ── Column specification ────────────────────────────────────────────────────────
#> Delimiter: ","
#> chr (1): vowel
#> dbl (3): F1, F2, F3
#>
#> ℹ Use `spec()` to retrieve the full column specification for this data.
#> ℹ Specify the column types or set `show_col_types = FALSE` to quiet this message.Let’s have a look at f_bark.
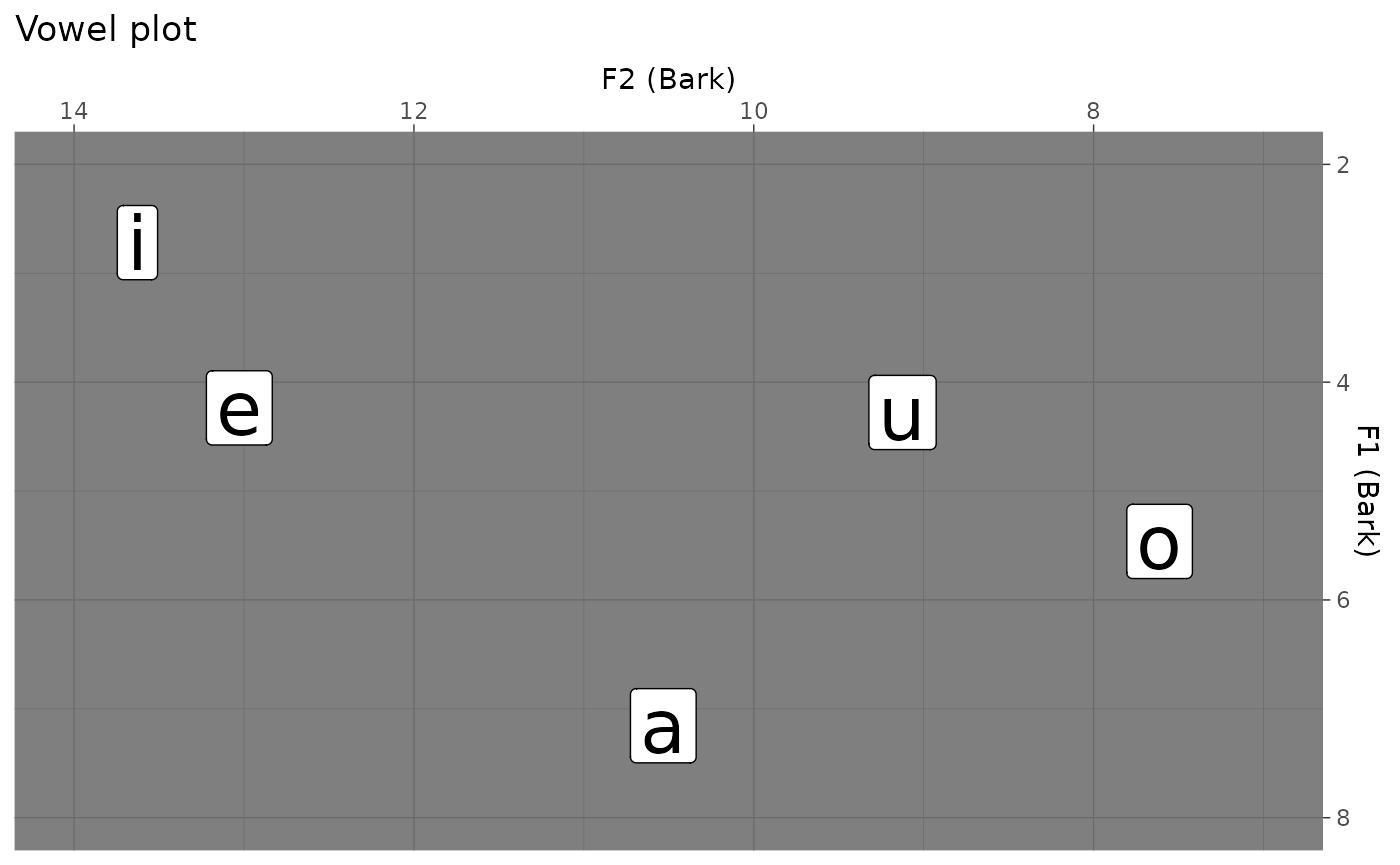
f_bark
#> # A tibble: 5 × 4
#>   vowel    F1    F2    F3
#>   <chr> <dbl> <dbl> <dbl>
#> 1 a      7.16 10.5   14.2
#> 2 e      4.24 13.0   14.2
#> 3 i      2.72 13.6   15.2
#> 4 o      5.46  7.61  14.3
#> 5 u      4.28  9.12  15.1
And plot it.
f_bark |>
  ggplot(aes(F2, F1, label = vowel)) +
  geom_label(size = 10) +
  labs(
    title = "Vowel plot",
    x = "F2 (Bark)",
    y = "F1 (Bark)"
  ) +
  scale_x_reverse(position = "top", limits = c(14, 7)) +
  scale_y_reverse(position = "right", limits = c(8, 2))