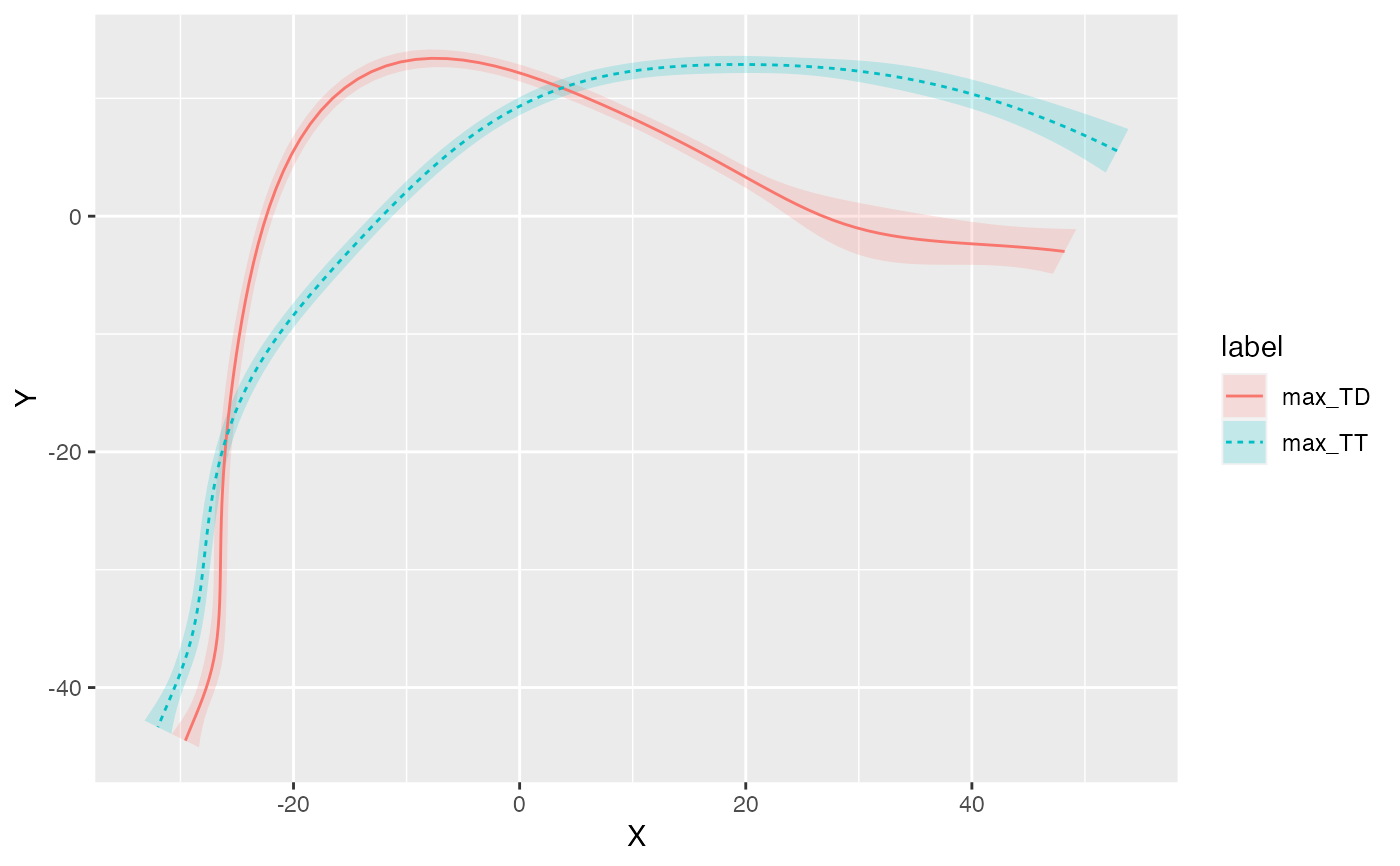
It plots the smooths of a polar GAM fitted with polar_gam().
plot_polar_smooths(
  model,
  series,
  comparison = NULL,
  origin = NULL,
  facet_terms = NULL,
  conditions = NULL,
  exclude_random = TRUE,
  series_length = 100,
  split = NULL,
  sep = "\\.",
  time_series
)
Arguments
- model
A
gamorbammodel object.- series
An unquoted expression indicating the model term that defines the series on which smoothing is applied. This is the term that is displayed on the x-axis when plotting.
- comparison
An unquoted expression indicating the model term for which the comparison will be plotted.
- origin
The coordinates of the origin as a vector of
c(x, y)coordinates.- facet_terms
An unquoted formula with the terms used for faceting.
- conditions
A list of quosures with
quosspecifying the levels to plot from the model terms not amongseries,comparison, orfacet_terms.- exclude_random
Whether to exclude random smooths (the default is
TRUE).- series_length
An integer indicating how many values along the time series to use for predicting the outcome term.
- split
Columns to separate as a named list.
- sep
Separator between columns (default is
"\.", which is the default with). If character, it is interpreted as a regular expression.- time_series
Deprecated, use
seriesinstead.
Value
An object of class ggplot.
Examples
# \donttest{
library(dplyr)
#>
#> Attaching package: ‘dplyr’
#> The following objects are masked from ‘package:stats’:
#>
#>     filter, lag
#> The following objects are masked from ‘package:base’:
#>
#>     intersect, setdiff, setequal, union
tongue_it01 <- filter(tongue, speaker == "it01")
pgam <- polar_gam(Y ~ s(X, by = as.factor(label)), data = tongue_it01)
#> The origin is x = 14.3901267816422, y = -65.2315420525847.

plot_polar_smooths(pgam, X, label)

# }
# }