plot_smooths(
  model,
  series,
  comparison = NULL,
  facet_terms = NULL,
  conditions = NULL,
  exclude_random = TRUE,
  exclude_terms = NULL,
  series_length = 25,
  split = NULL,
  sep = "\\.",
  transform = NULL,
  ci_z = 1.96,
  time_series
)
Arguments
| model | A |
|---|---|
| series | An unquoted expression indicating the model term that defines the series on which smoothing is applied. This is the term that is displayed on the x-axis when plotting. |
| comparison | An unquoted expression indicating the model term for which the comparison will be plotted. |
| facet_terms | An unquoted formula with the terms used for faceting. |
| conditions | A list of quosures with |
| exclude_random | Whether to exclude random smooths (the default is |
| exclude_terms | Terms to be excluded from the prediction. Term names should be given as they appear in the model summary (for example, |
| series_length | An integer indicating how many values along the time series to use for predicting the outcome term. |
| split | Columns to separate as a named list. |
| sep | Separator between columns (default is |
| transform | Function used to transform the fitted values (useful for getting plots on the response scale). |
| ci_z | The z-value for calculating the CIs (the default is |
| time_series | Deprecated, use |
Value
A ggplot object.
Examples
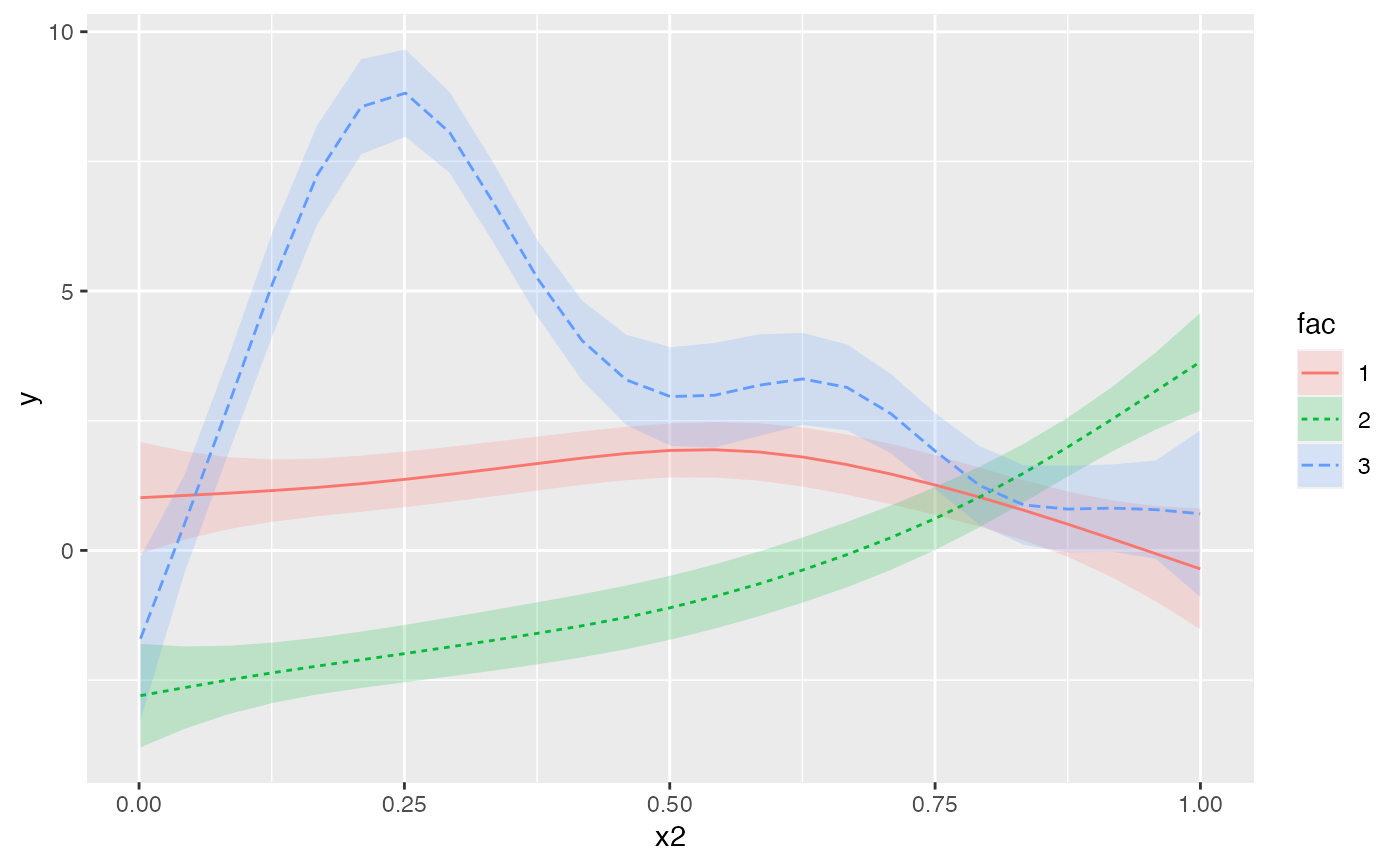
#> Factor `by' variable example# alternative model specification model <- gam(y ~ s(fac, bs = "re") + s(x2) + s(x2, by = fac) + s(x0), data = data) plot_smooths(model, x2, fac)

