Learn Generalised Additive (Mixed) Models

Dr Stefano Coretta

University of Edinburgh

2024-04-18

Generalised additive models

  • Genrealised Additive Models (GAMs)

  • \(y = f(x)\)

    • \(f(x)\) = some function of \(x\) (or smooth function)
  • Extension of “linear” models (linear on the link function).

    • Fitting both linear and non-linear effects.
  • Very flexible.

    • Makes interpretation of results less straightforward.

Smooth terms

LMs have only parametric terms

  • f0 ~ vowel + voicing + duration

  • Parametric terms fit linear effects.

GAMs add (non-parametric) smooth terms (or simply smooths, also smoothers):

  • f0 ~ vowel + voicing + s(duration)

  • f(x): some function of \(x\).

  • Smooth terms fit non-linear effects.

mgcv package

library(mgcv)
gam(y ~ s(x), data)

The model: \(y\) as some function of \(x\)

Example: pupil size

  • Pupillometry data from English young and older adults (McLaughlin et al 2022, https://doi.org/10.3758/s13423-021-01991-0). In Arbitrary Units (AU).

  • Word recognition task (verbal stimulus + verbal response).

  • Words with sparse and dense neighbourhood density.

Hypotheses:

  • Recognizing words with more competitors (dense neighbourhood) should come at a greater cognitive cost (greater pupil size) relative to recognizing words with fewer competitors (sparse neighbourhood).

  • The cognitive demands associated with increased neighbourhood density (greater pupil size) should be greater for older adults compared with young adults.

Example: pupil size

  • The original study used Growth Curve Analysis (GCA).

  • We will apply GAMs instead.

  • CAVEAT: We are analysing the whole time course, rather than just a subset as done in the original study.

The data

pdq_20 <- readRDS("data/pdq_20.rds") %>%
  mutate(
    Condition = factor(Condition, levels = c("Sparse", "Dense")),
    Age = factor(Age, levels = c("YA", "OA")),
    pupil_z = (pupil.binned - mean(pupil.binned)) / sd(pupil.binned)
  )
pdq_20
# A tibble: 88,008 × 8
   subject trial Condition Age   timebins Soundfile        pupil.binned  pupil_z
     <dbl> <dbl> <fct>     <fct>    <dbl> <chr>                   <dbl>    <dbl>
 1       1     1 Sparse    YA        -500 NAMword_675_Mul…       84.5    0.00347
 2       1     1 Sparse    YA        -480 NAMword_675_Mul…       75.8   -0.0239 
 3       1     1 Sparse    YA        -460 NAMword_675_Mul…       65.4   -0.0570 
 4       1     1 Sparse    YA        -440 NAMword_675_Mul…       54.3   -0.0922 
 5       1     1 Sparse    YA        -420 NAMword_675_Mul…       35.7   -0.151  
 6       1     1 Sparse    YA        -400 NAMword_675_Mul…       20.2   -0.200  
 7       1     1 Sparse    YA        -380 NAMword_675_Mul…        8.72  -0.237  
 8       1     1 Sparse    YA        -360 NAMword_675_Mul…        0.680 -0.262  
 9       1     1 Sparse    YA        -340 NAMword_675_Mul…      -11.4   -0.300  
10       1     1 Sparse    YA        -320 NAMword_675_Mul…      -23.3   -0.338  
# ℹ 87,998 more rows
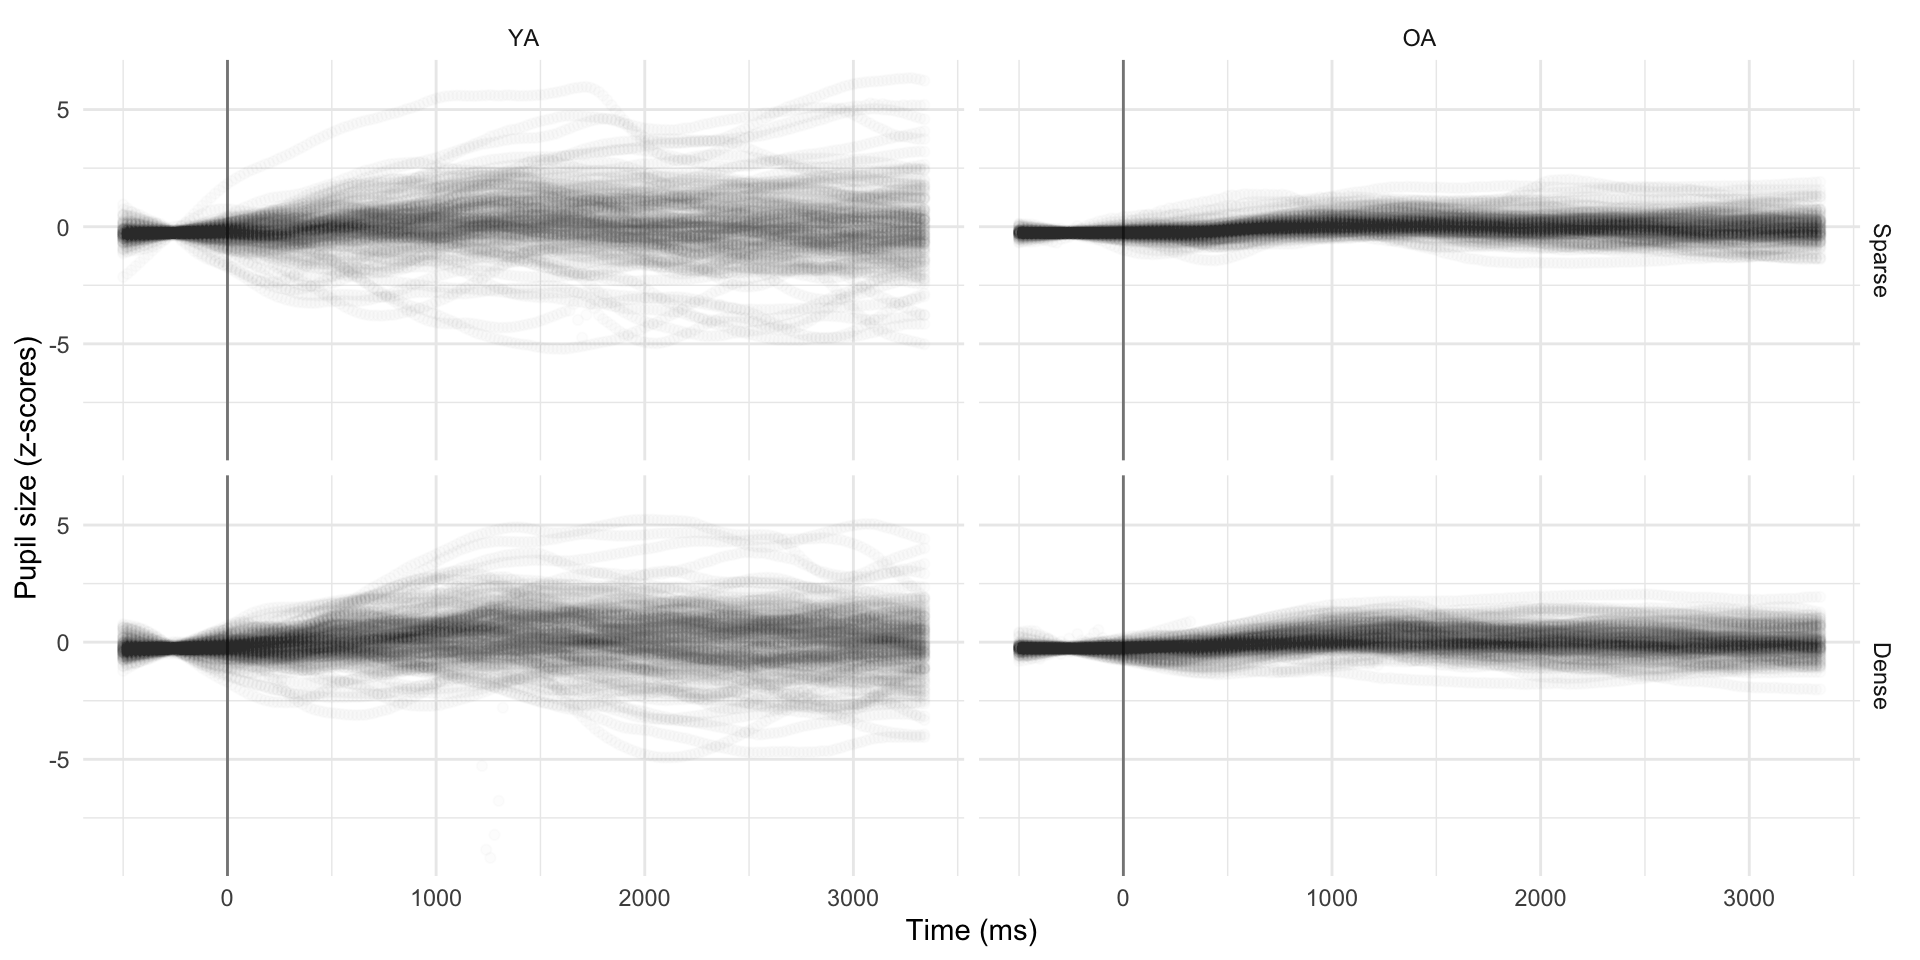
The data

A simple GAM: pupil size along time

library(mgcv)

pdq_gam <- gam(
  # Outcome
  pupil_z ~
    # Smooth over timebins
    s(timebins),
  data = pdq_20
)

A simple GAM: model summary

summary(pdq_gam)

Family: gaussian 
Link function: identity 

Formula:
pupil_z ~ s(timebins)

Parametric coefficients:
              Estimate Std. Error t value Pr(>|t|)
(Intercept) -2.607e-14  3.316e-03       0        1

Approximate significance of smooth terms:
              edf Ref.df     F p-value
s(timebins) 7.891  8.679 334.7  <2e-16

R-sq.(adj) =  0.0321   Deviance explained = 3.21%
GCV = 0.96804  Scale est. = 0.96794   n = 88008

A simple GAM: model summary

Parametric coefficients:
              Estimate Std. Error t value Pr(>|t|)
(Intercept) -2.607e-14  3.316e-03       0        1

Approximate significance of smooth terms:
              edf Ref.df     F p-value
s(timebins) 7.891  8.679 334.7  <2e-16
  • The parametric term’s coefficient is an estimate of the mean height.

  • The smooth’s EDFs (estimated degrees of freedom) indicate whether it is a straight line (EDF = 1) or not.

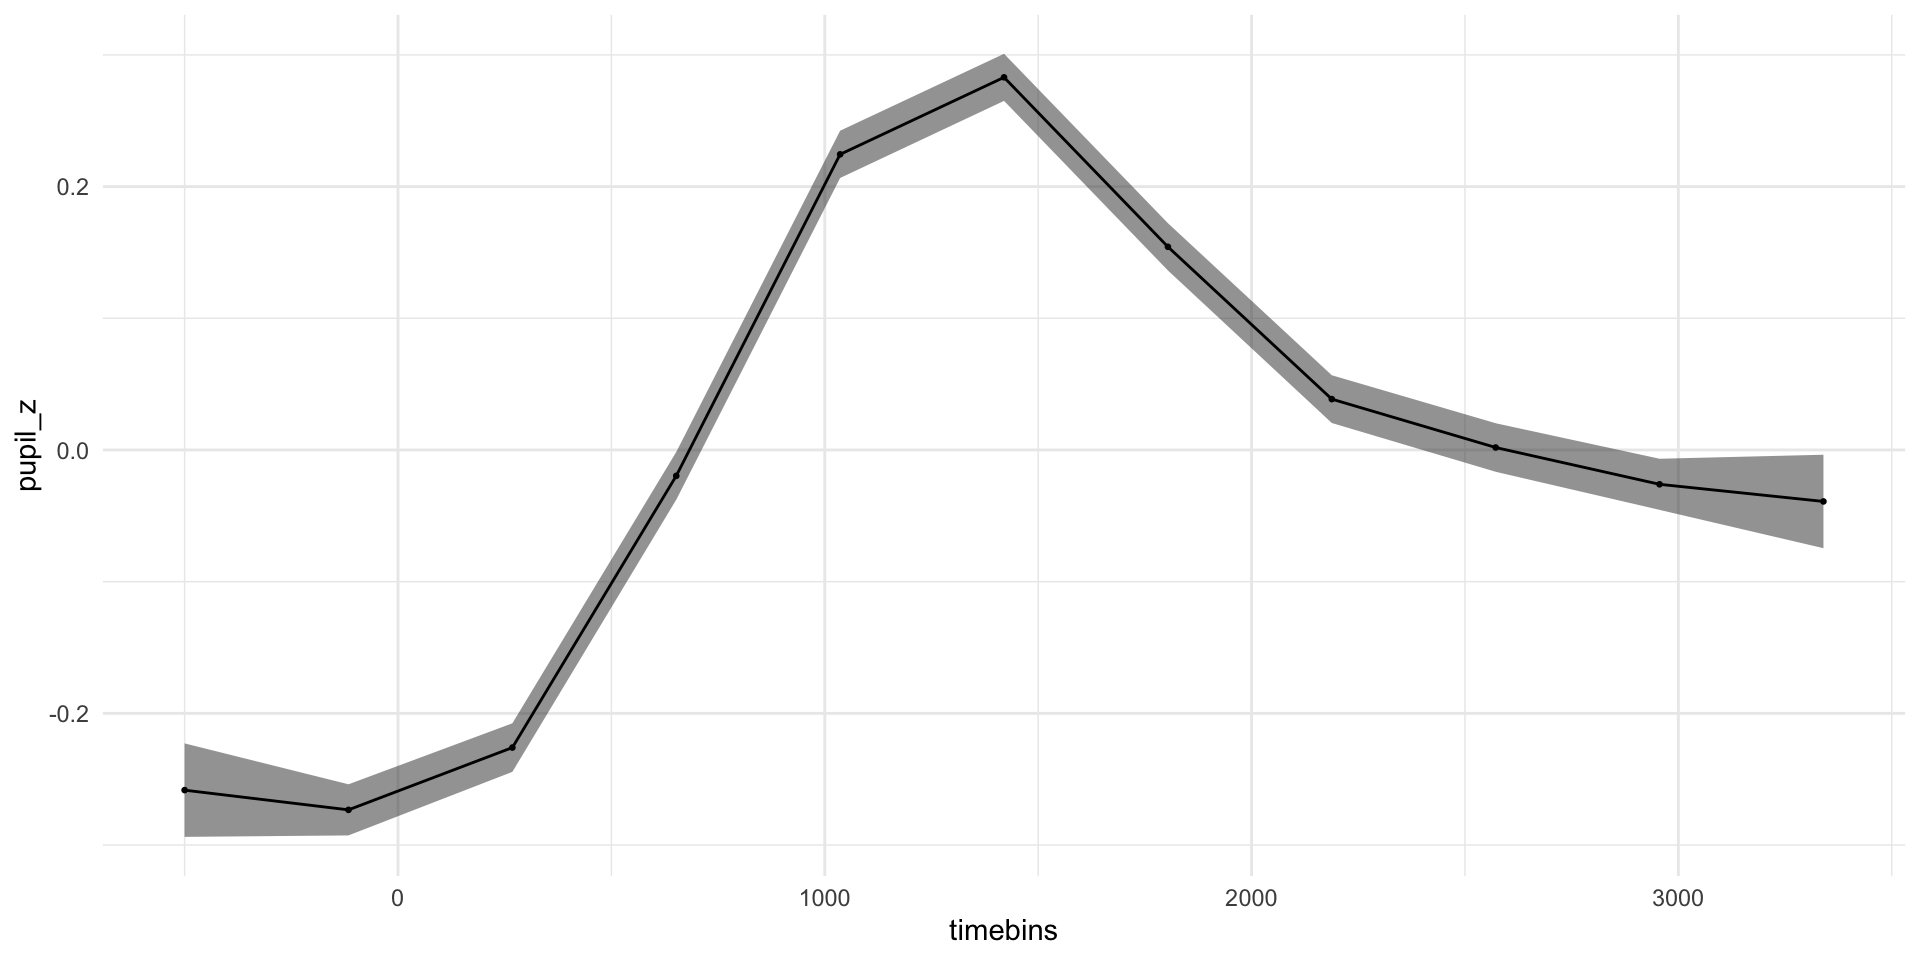
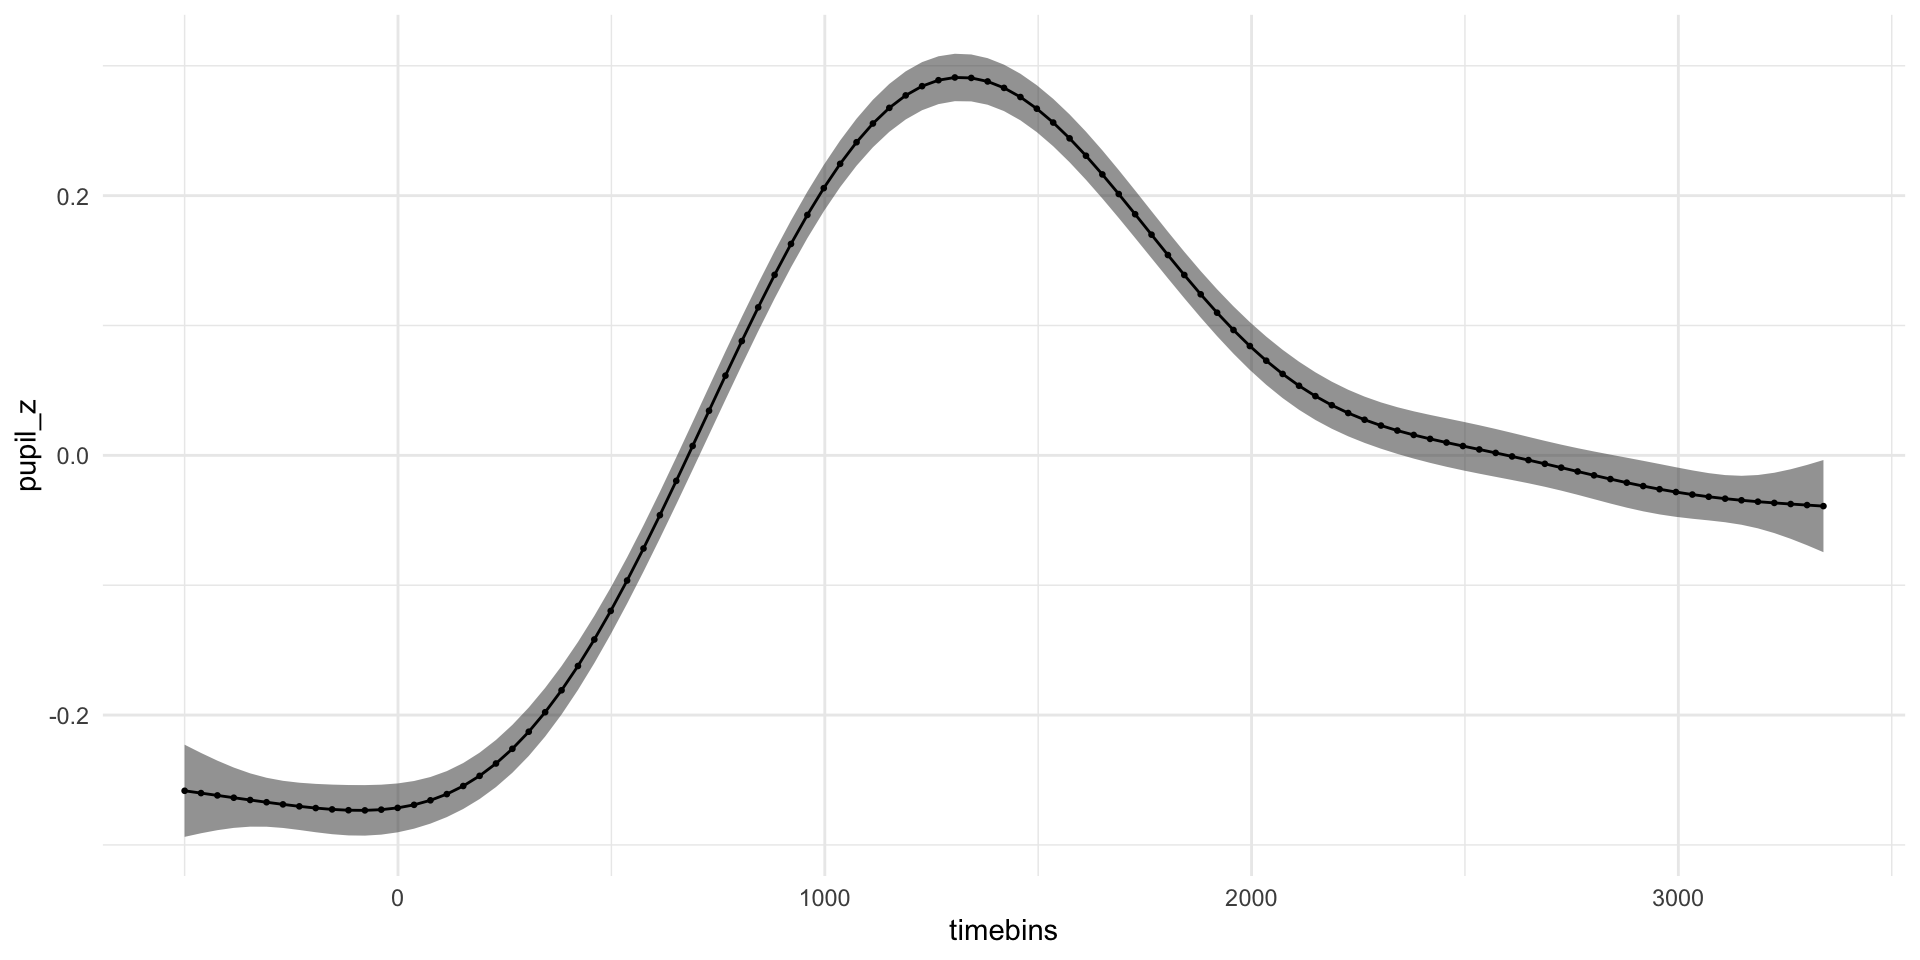
A simple GAM: predict pupil size

library(tidygam)

predict_gam(pdq_gam)
# A tibble: 11 × 5
   timebins  pupil_z      se lower_ci[,1] upper_ci[,1]
      <dbl>    <dbl>   <dbl>        <dbl>        <dbl>
 1     -500 -0.258   0.0181       -0.294      -0.223  
 2     -116 -0.273   0.00990      -0.293      -0.254  
 3      268 -0.226   0.00941      -0.244      -0.208  
 4      652 -0.0196  0.00925      -0.0378     -0.00152
 5     1036  0.224   0.00916       0.207       0.242  
 6     1420  0.283   0.00912       0.265       0.301  
 7     1804  0.154   0.00916       0.136       0.172  
 8     2188  0.0386  0.00925       0.0205      0.0568 
 9     2572  0.00188 0.00941      -0.0166      0.0203 
10     2956 -0.0261  0.00990      -0.0455     -0.00666
11     3340 -0.0391  0.0181       -0.0746     -0.00359

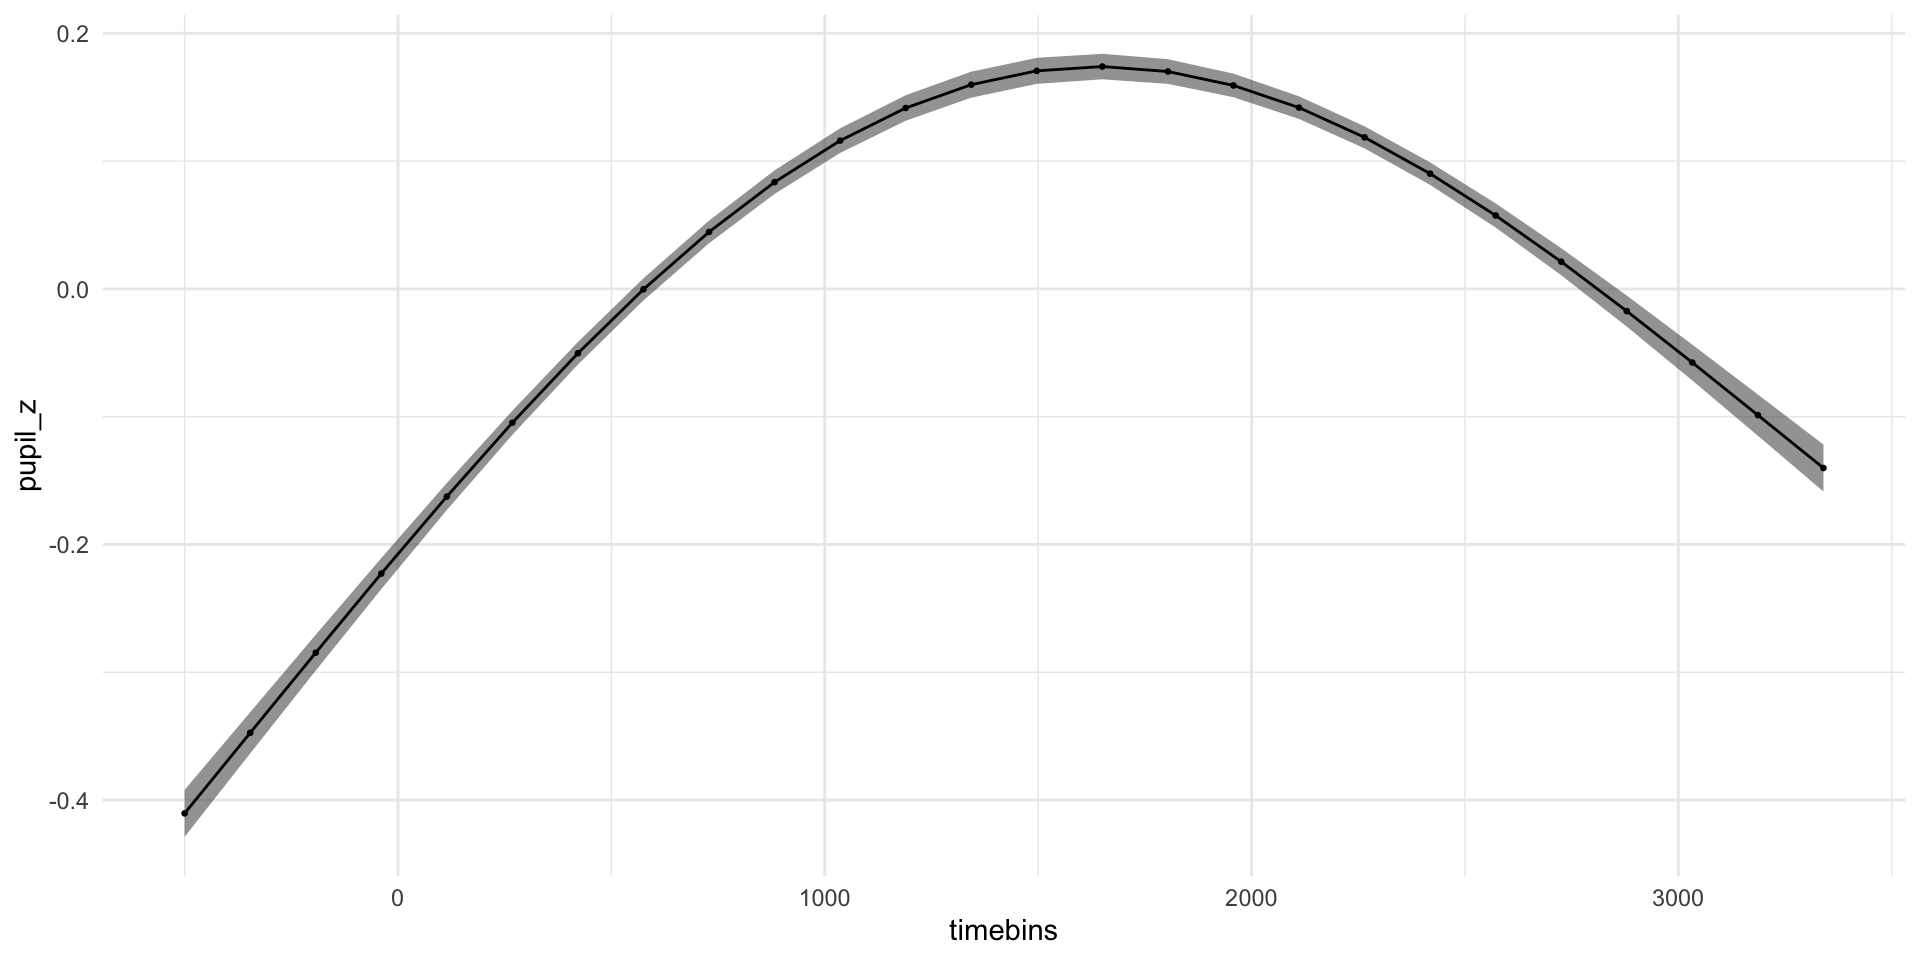
A simple GAM: plot predicted pupil size

predict_gam(pdq_gam) %>% plot(series = "timebins")

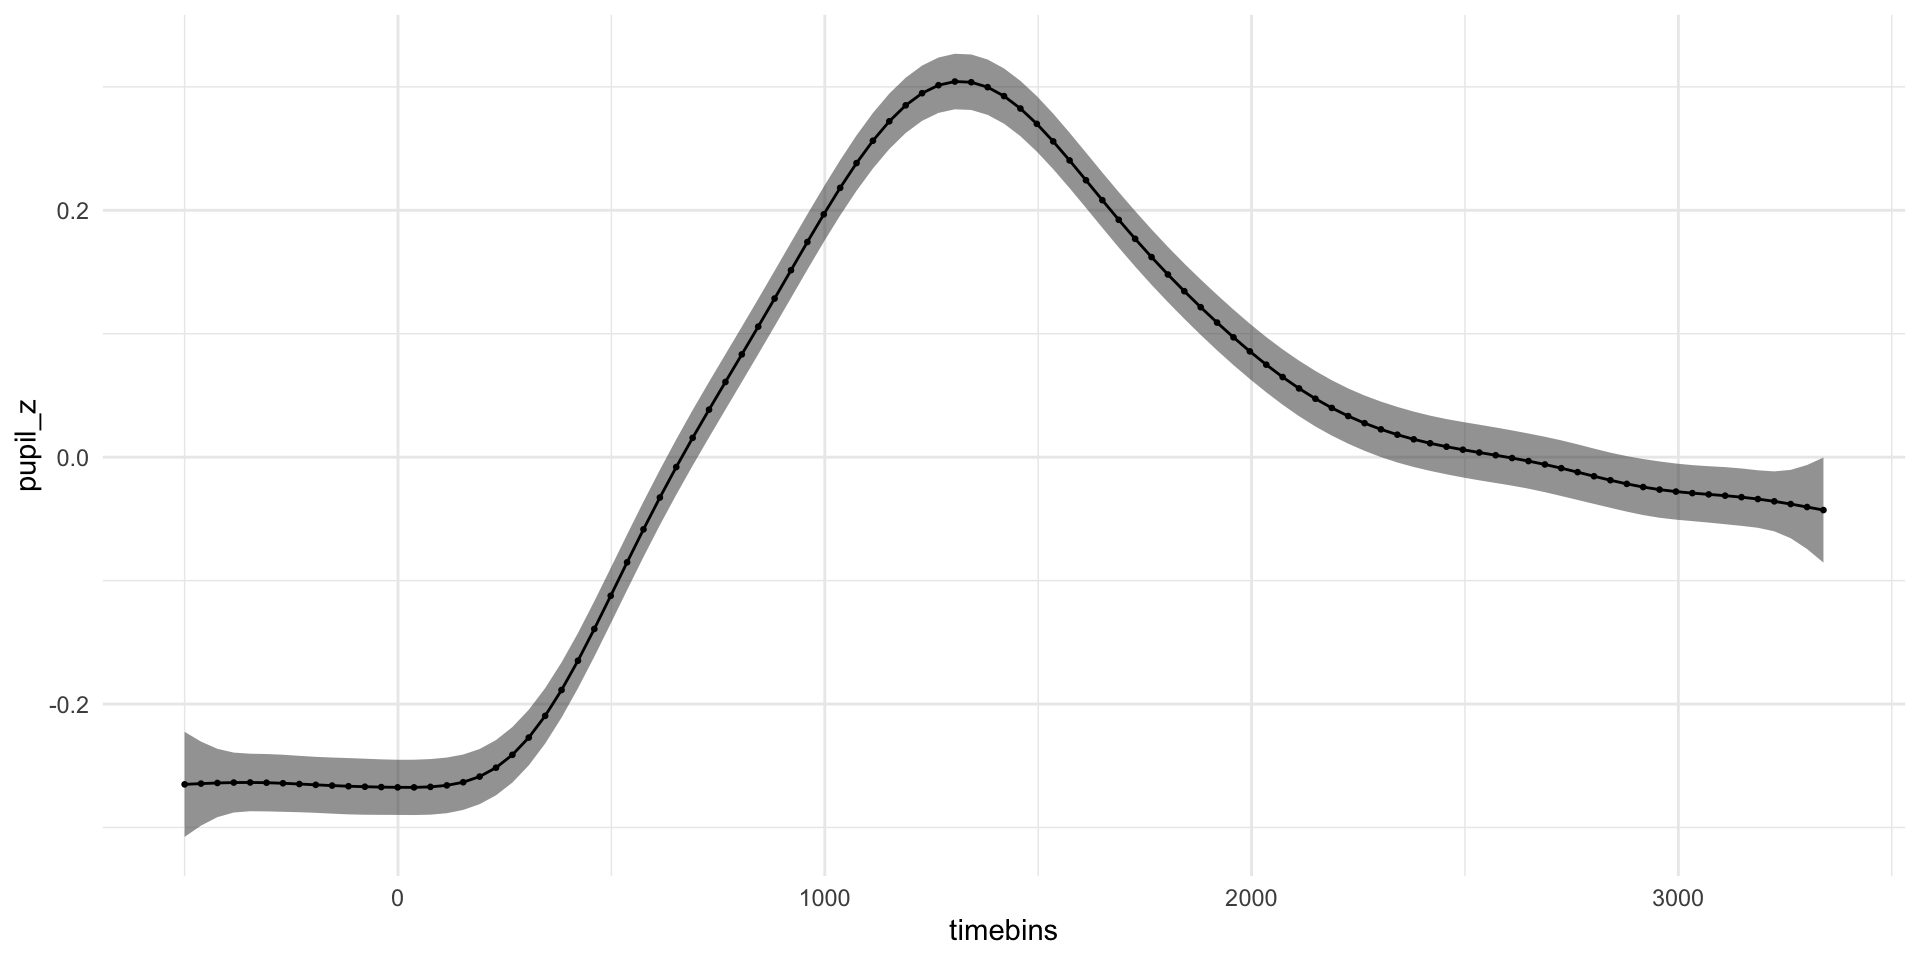
Increase length_out for smoother curves

predict_gam(pdq_gam, length_out = 100) %>% plot(series = "timebins")

Number of knots k

  • The “wiggliness” of the resulting curve is partially constrained by the number of knots (k).

  • The more knots, the more wiggly the curve can be. Or the more knots the less smooth the curve can be.

  • You can set the number of knots k with the argument k in s().

  • k cannot be larger than the number of “sampling points” in the variable to smooth over.

Setting k = 3

# Use bam(): Big gAM
pdq_gam_2 <- bam(
  pupil_z ~
    s(timebins, k = 3),
  data = pdq_20
)

k = 3: plot predictions

predict_gam(pdq_gam_2, length_out = 25) %>% plot(series = "timebins")

k = 20

pdq_gam_2 <- bam(
  pupil_z ~
    s(timebins, k = 20),
  data = pdq_20
)

k = 20: plot predictions

predict_gam(pdq_gam_2, length_out = 100) %>% plot(series = "timebins")

Comparing groups

  • Comparing levels from a variable (like age: young vs old) can be achieved with the by-variable method,

    • i.e. by specifying the variable as the value of the by argument in s().
  • by-variables have to be factors.


pdq_gam_3 <- bam(
  pupil_z ~
    Age +
    s(timebins, by = Age),
  data = pdq_20
)

Summary

summary(pdq_gam_3)

Family: gaussian 
Link function: identity 

Formula:
pupil_z ~ Age + s(timebins, by = Age)

Parametric coefficients:
             Estimate Std. Error t value Pr(>|t|)
(Intercept)  0.029418   0.004512   6.520 7.06e-11
AgeOA       -0.061471   0.006648  -9.246  < 2e-16

Approximate significance of smooth terms:
                    edf Ref.df     F p-value
s(timebins):AgeYA 8.270  8.854 223.2  <2e-16
s(timebins):AgeOA 8.109  8.787 116.9  <2e-16

R-sq.(adj) =  0.0339   Deviance explained = 3.41%
fREML = 1.2341e+05  Scale est. = 0.96613   n = 88008

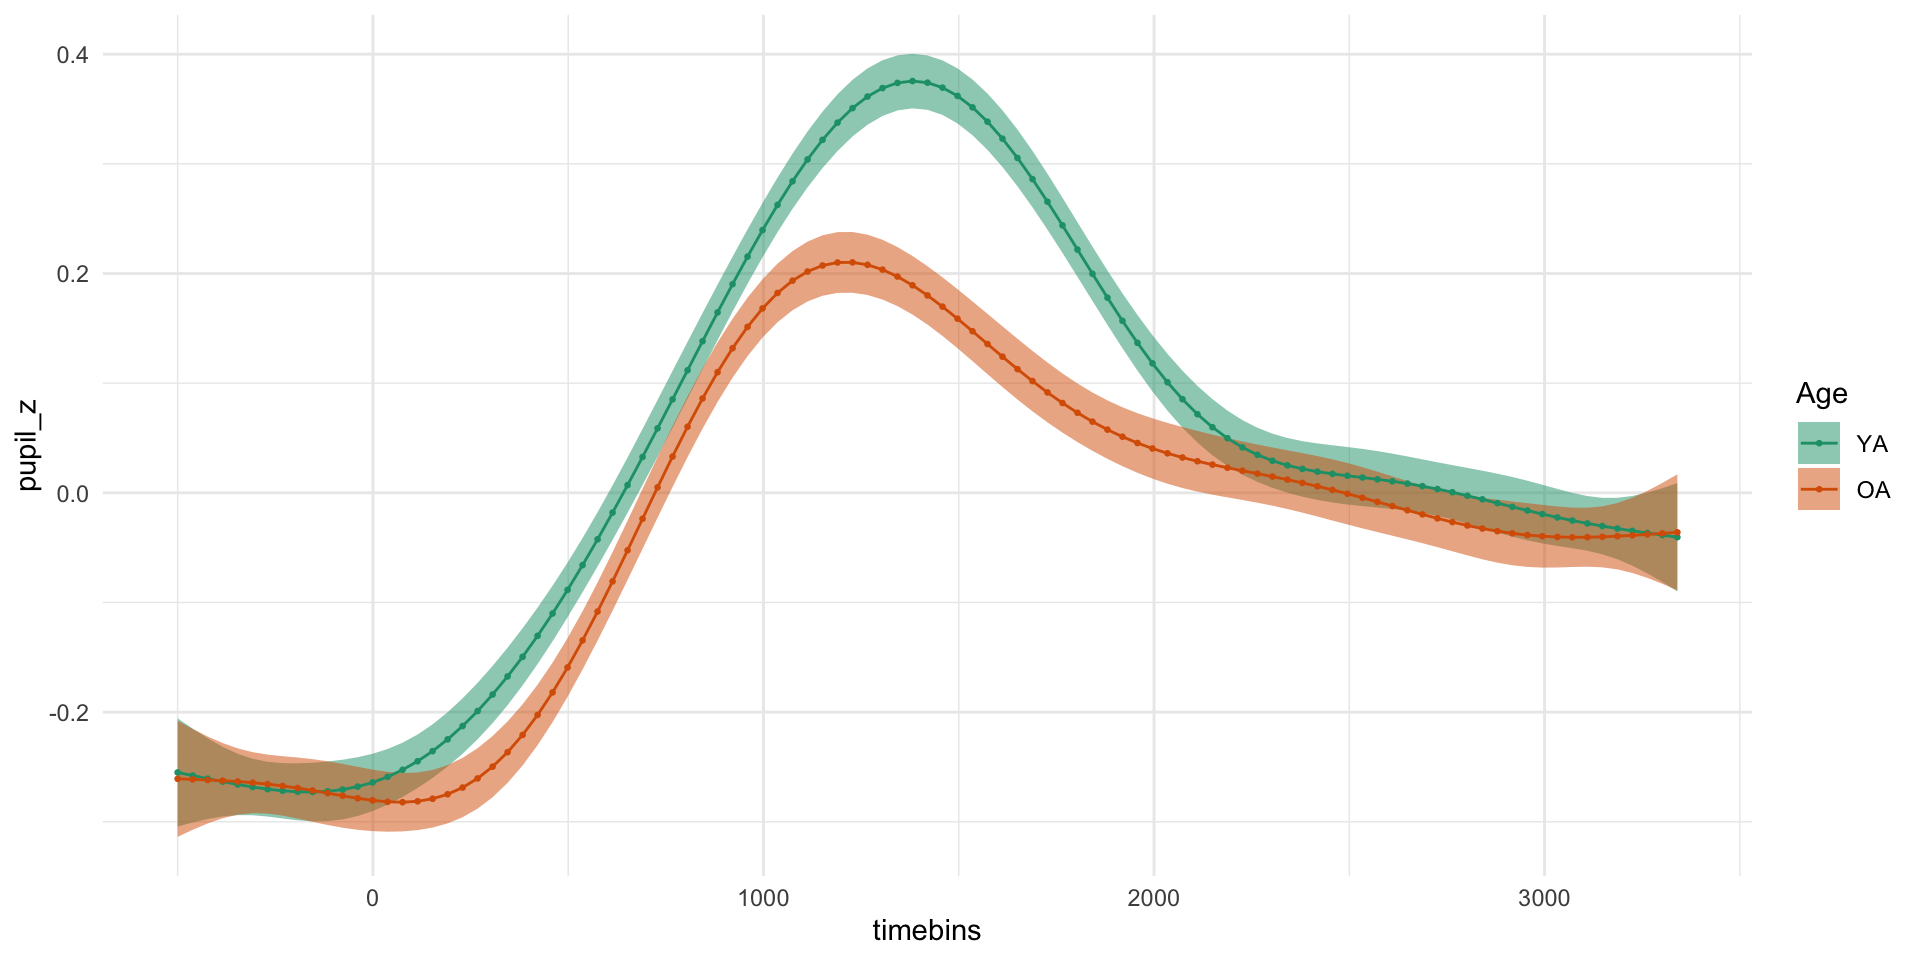
Plot predictions of groups

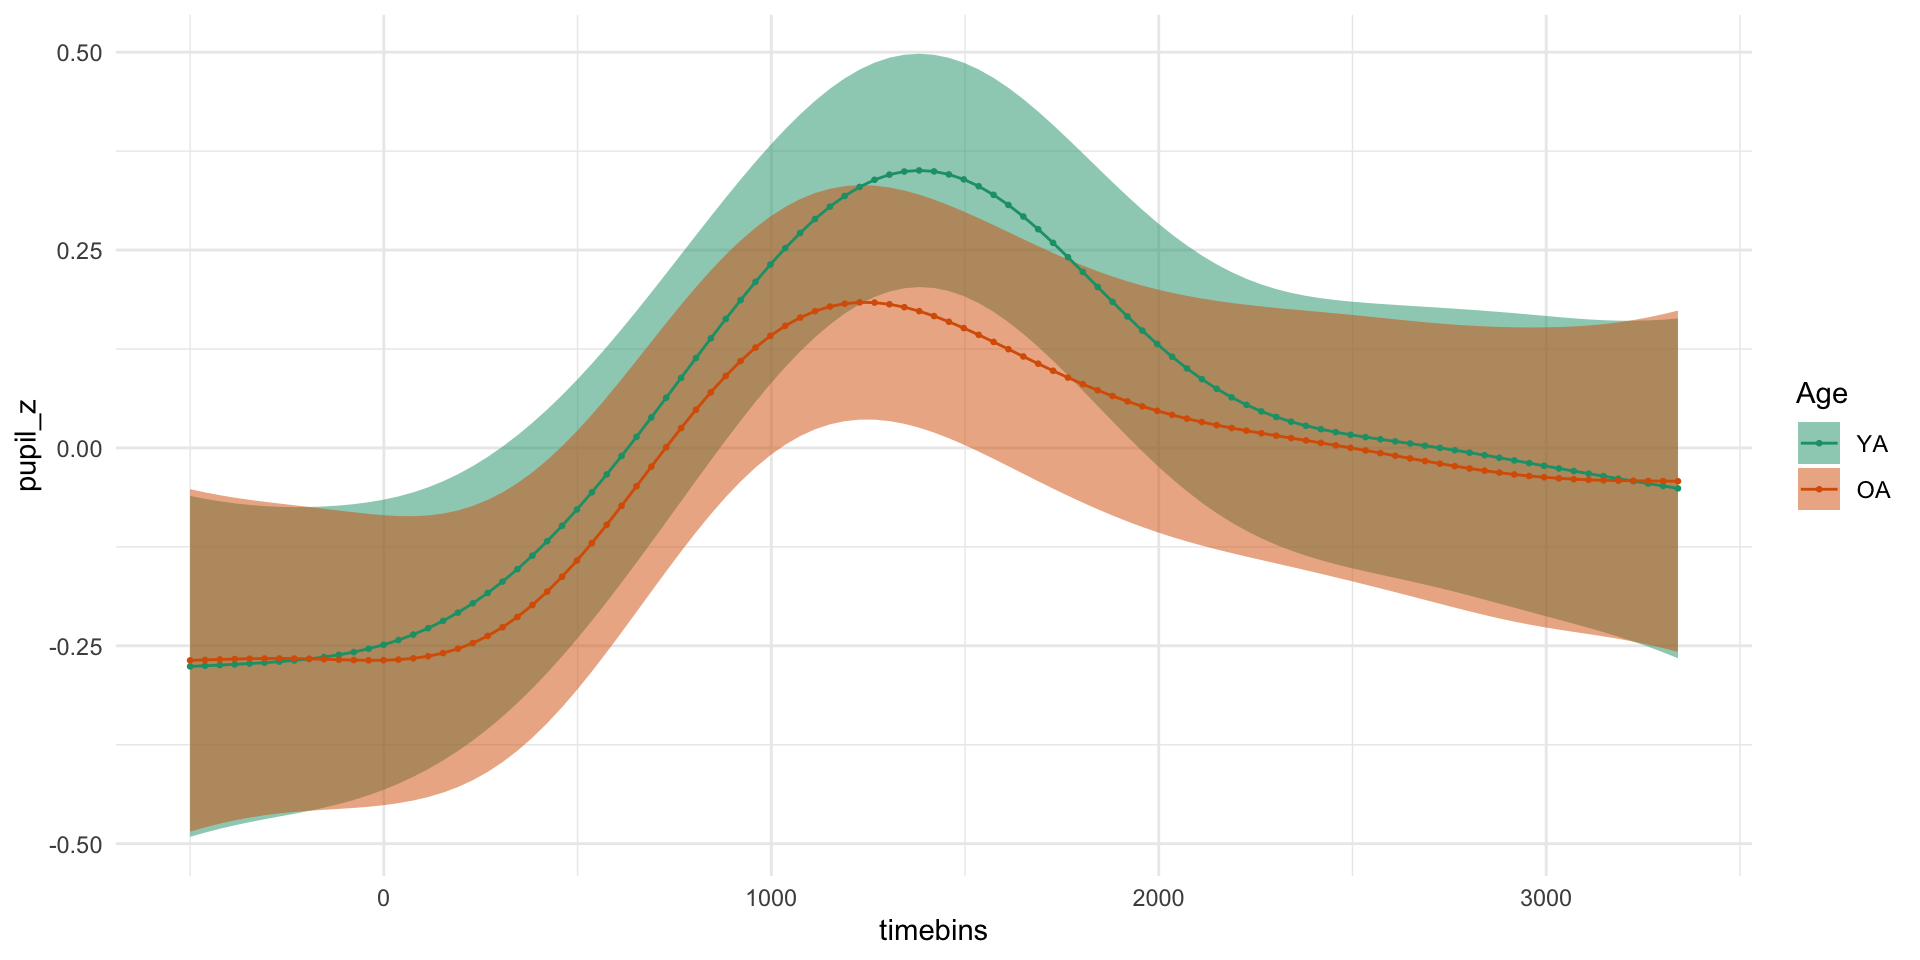
predict_gam(pdq_gam_3, length_out = 100) %>% plot(series = "timebins", comparison = "Age")

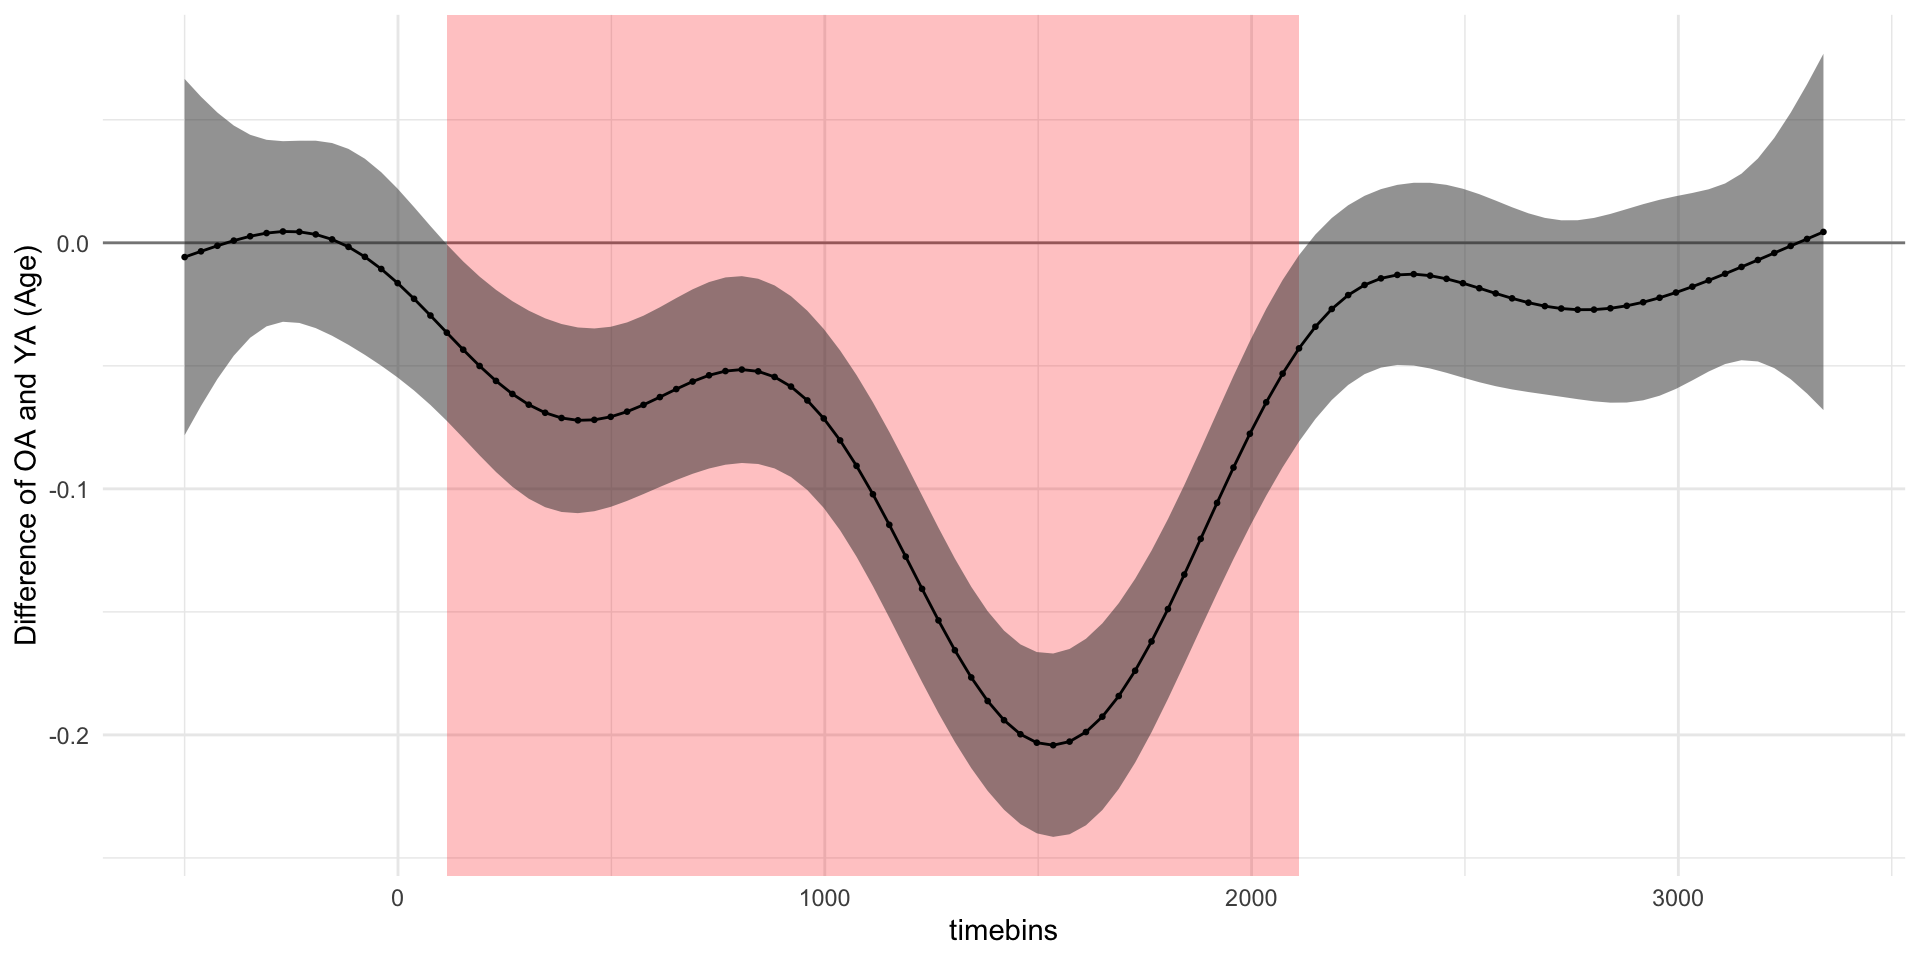
Get difference between curves

pdq_gam_3_diff <- get_difference(
  pdq_gam_3, series = "timebins", length_out = 100,
  compare = list(Age = c("OA", "YA"))
)
pdq_gam_3_diff
# A tibble: 101 × 6
   Age   timebins      diff     se lower_ci upper_ci
   <chr>    <dbl>     <dbl>  <dbl>    <dbl>    <dbl>
 1 OA-YA    -500  -0.00580  0.0369  -0.0782   0.0666
 2 OA-YA    -462. -0.00347  0.0321  -0.0663   0.0594
 3 OA-YA    -423. -0.00120  0.0276  -0.0553   0.0529
 4 OA-YA    -385.  0.000892 0.0239  -0.0459   0.0477
 5 OA-YA    -346.  0.00267  0.0210  -0.0386   0.0439
 6 OA-YA    -308   0.00396  0.0193  -0.0340   0.0419
 7 OA-YA    -270.  0.00461  0.0187  -0.0321   0.0413
 8 OA-YA    -231.  0.00446  0.0189  -0.0326   0.0415
 9 OA-YA    -193.  0.00342  0.0194  -0.0347   0.0415
10 OA-YA    -154.  0.00139  0.0200  -0.0378   0.0406
# ℹ 91 more rows

Plot difference between curves

pdq_gam_3_diff %>% plot()

Random effects

Only fixed effects so far…

  • Parametric terms.
  • Smooth terms.

Generalised Additive Mixed Models (GAMMs).

Two ways of including random effects:

  • Use the "re" basis function (bs argument in s()) for random intercept and slopes.

  • Include a random smooth term with the factor smooth interaction as basis (bs = "fs").

Random effects with “factor smooth interactions”

Factor smooth interaction: * Specified with bs = "fs" in s(). * A smooth is fitted at each level of a factor. * NOTE: it has interaction in the name but has nothing to do with interactions.

The random effect variable needs to be a factor.

Subject as factor

Let’s change subject to a factor.

pdq_20 <- pdq_20 %>%
  mutate(
    subject = as.factor(subject)
  )
pdq_20
# A tibble: 88,008 × 8
   subject trial Condition Age   timebins Soundfile        pupil.binned  pupil_z
   <fct>   <dbl> <fct>     <fct>    <dbl> <chr>                   <dbl>    <dbl>
 1 1           1 Sparse    YA        -500 NAMword_675_Mul…       84.5    0.00347
 2 1           1 Sparse    YA        -480 NAMword_675_Mul…       75.8   -0.0239 
 3 1           1 Sparse    YA        -460 NAMword_675_Mul…       65.4   -0.0570 
 4 1           1 Sparse    YA        -440 NAMword_675_Mul…       54.3   -0.0922 
 5 1           1 Sparse    YA        -420 NAMword_675_Mul…       35.7   -0.151  
 6 1           1 Sparse    YA        -400 NAMword_675_Mul…       20.2   -0.200  
 7 1           1 Sparse    YA        -380 NAMword_675_Mul…        8.72  -0.237  
 8 1           1 Sparse    YA        -360 NAMword_675_Mul…        0.680 -0.262  
 9 1           1 Sparse    YA        -340 NAMword_675_Mul…      -11.4   -0.300  
10 1           1 Sparse    YA        -320 NAMword_675_Mul…      -23.3   -0.338  
# ℹ 87,998 more rows
Fit model with random smooths

pdq_gam_4 <- bam(
  pupil_z ~
    # Parametric term
    Age +
    # Smooth term
    s(timebins, by = Age) +
    # Factor smooth interaction by subject
    s(timebins, subject, bs = "fs", m = 1),
  data = pdq_20
)

Summary

summary(pdq_gam_4)

Family: gaussian 
Link function: identity 

Formula:
pupil_z ~ Age + s(timebins, by = Age) + s(timebins, subject, 
    bs = "fs", m = 1)

Parametric coefficients:
            Estimate Std. Error t value Pr(>|t|)
(Intercept)  0.02897    0.06406   0.452    0.651
AgeOA       -0.06099    0.09061  -0.673    0.501

Approximate significance of smooth terms:
                        edf  Ref.df      F p-value
s(timebins):AgeYA     7.274   7.733  9.943  <2e-16
s(timebins):AgeOA     6.968   7.491  6.174  <2e-16
s(timebins,subject) 140.129 178.000 33.486  <2e-16

R-sq.(adj) =  0.0951   Deviance explained = 9.67%
fREML = 1.2073e+05  Scale est. = 0.90486   n = 88008

Plot pupil size by Age

predict_gam(pdq_gam_4, length_out = 100, exclude_terms = "s(timebins,subject)", values = c(subject = "1")) %>%
  plot(series = "timebins", comparison = "Age")

Get difference by Age

pdq_gam_4_diff <- tidygam::get_difference(
  pdq_gam_4, series = "timebins", length_out = 100, exclude_terms = "s(timebins,subject)",
  compare = list(Age = c("OA", "YA"))
)

Plot difference by Age

pdq_gam_4_diff %>% plot()

Factor smooth interactions by subject

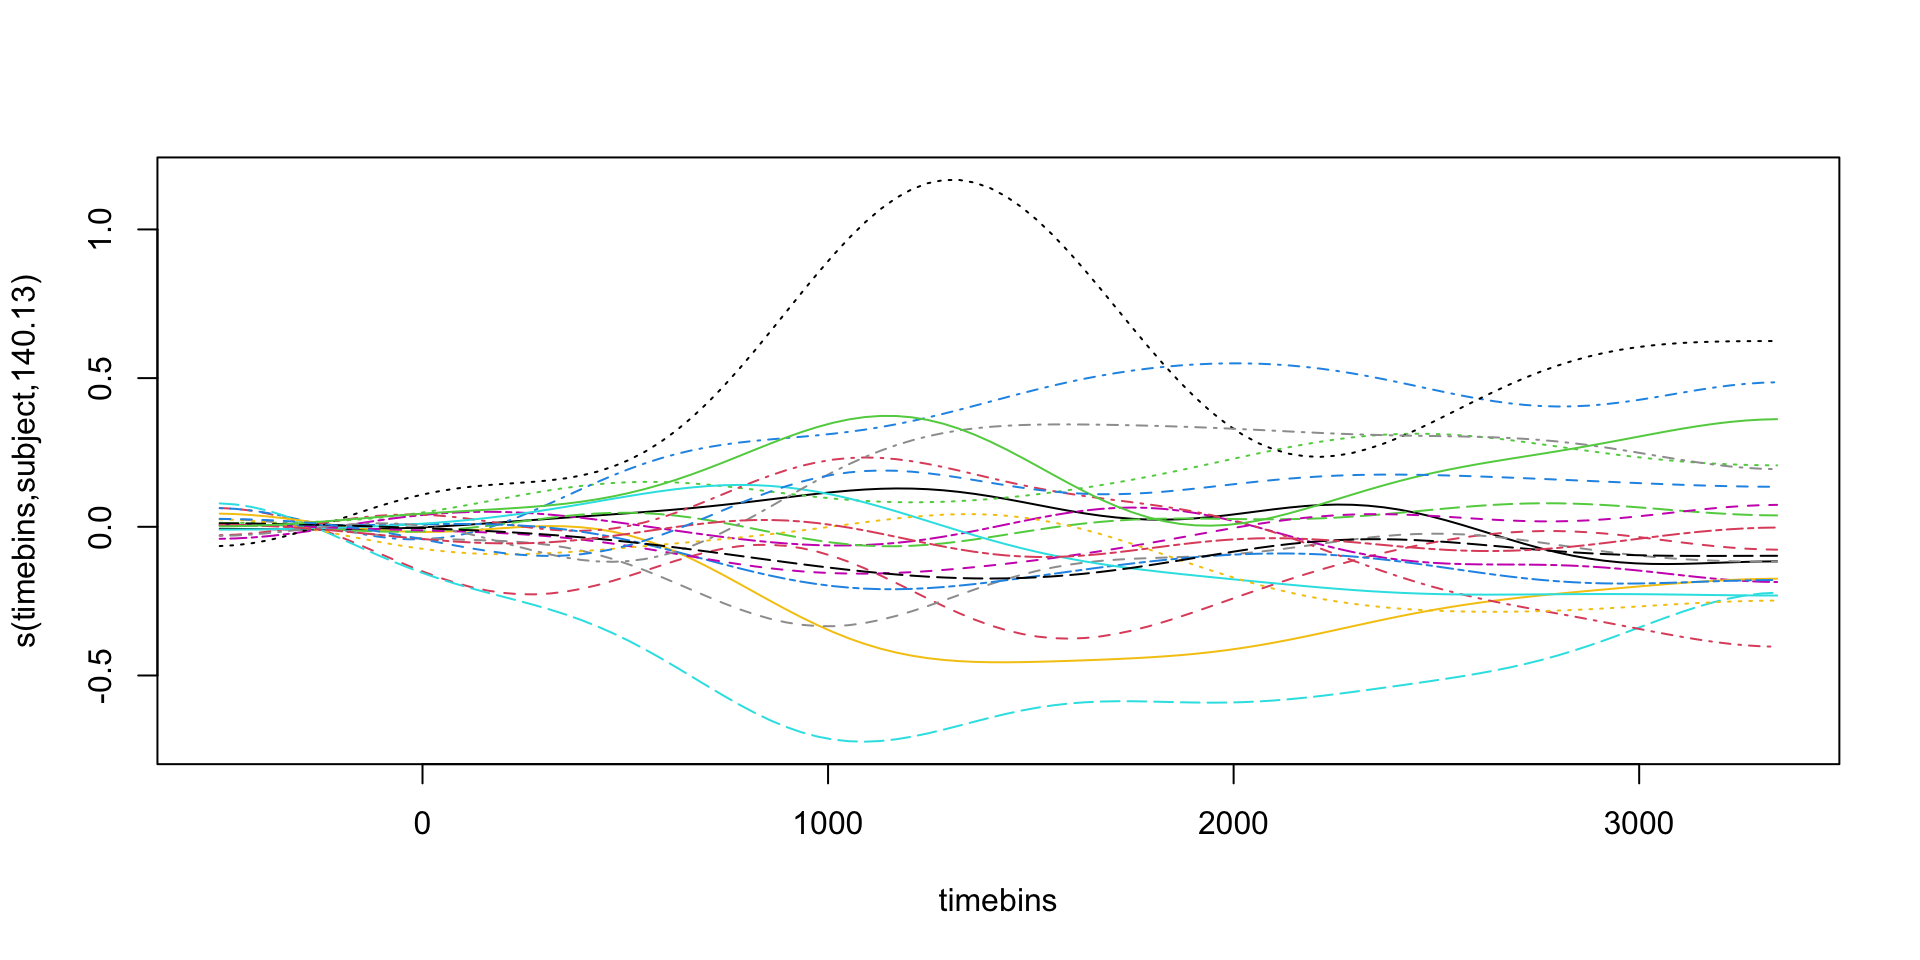
plot(pdq_gam_4, select = 3)

Comparing across groups (interactions)

Technically, GAMs don’t allow interactions.

  • They are ADDITIVE (interactions require multiplication).

We can get interaction-like comparisons by creating factor interactions and using them as by-variables. (Note that factor interactions are not the same thing as factor smooth interactions).

Factor interactions

  • Let’s create a factor interaction between Age and Condition.

  • Note that the model will include only this factor interaction (no need for Age and Condition separately).


pdq_20 <- pdq_20 %>%
  mutate(
    Age_Cond = interaction(Age, Condition)
  )

Fit the model with Age_Cond

pdq_gam_5 <- bam(
  pupil_z ~
    # Parametric term
    Age_Cond +
    # Smooth term
    s(timebins, by = Age_Cond, k = 20) +
    # Factor smooth interaction by subject
    s(timebins, subject, bs = "fs", m = 1),
  data = pdq_20
)

Model summary

summary(pdq_gam_5)

Family: gaussian 
Link function: identity 

Formula:
pupil_z ~ Age_Cond + s(timebins, by = Age_Cond, k = 20) + s(timebins, 
    subject, bs = "fs", m = 1)

Parametric coefficients:
                   Estimate Std. Error t value Pr(>|t|)
(Intercept)        0.003547   0.064262   0.055    0.956
Age_CondOA.Sparse -0.037032   0.090907  -0.407    0.684
Age_CondYA.Dense   0.047044   0.008803   5.344 9.12e-08
Age_CondOA.Dense  -0.034171   0.090893  -0.376    0.707

Approximate significance of smooth terms:
                                  edf  Ref.df      F  p-value
s(timebins):Age_CondYA.Sparse   8.711  10.672  6.237  < 2e-16
s(timebins):Age_CondOA.Sparse   5.027   6.040  3.191 0.003875
s(timebins):Age_CondYA.Dense    8.002   9.779  6.464  < 2e-16
s(timebins):Age_CondOA.Dense    6.191   7.582  4.061 0.000126
s(timebins,subject)           144.275 178.000 33.697  < 2e-16

R-sq.(adj) =  0.0958   Deviance explained = 9.76%
fREML = 1.2073e+05  Scale est. = 0.9042    n = 88008

Plot predictions by Age_Cond

predict_gam(pdq_gam_5, length_out = 100, exclude_terms = "s(timebins,subject)", values = c(subject = "1")) %>%
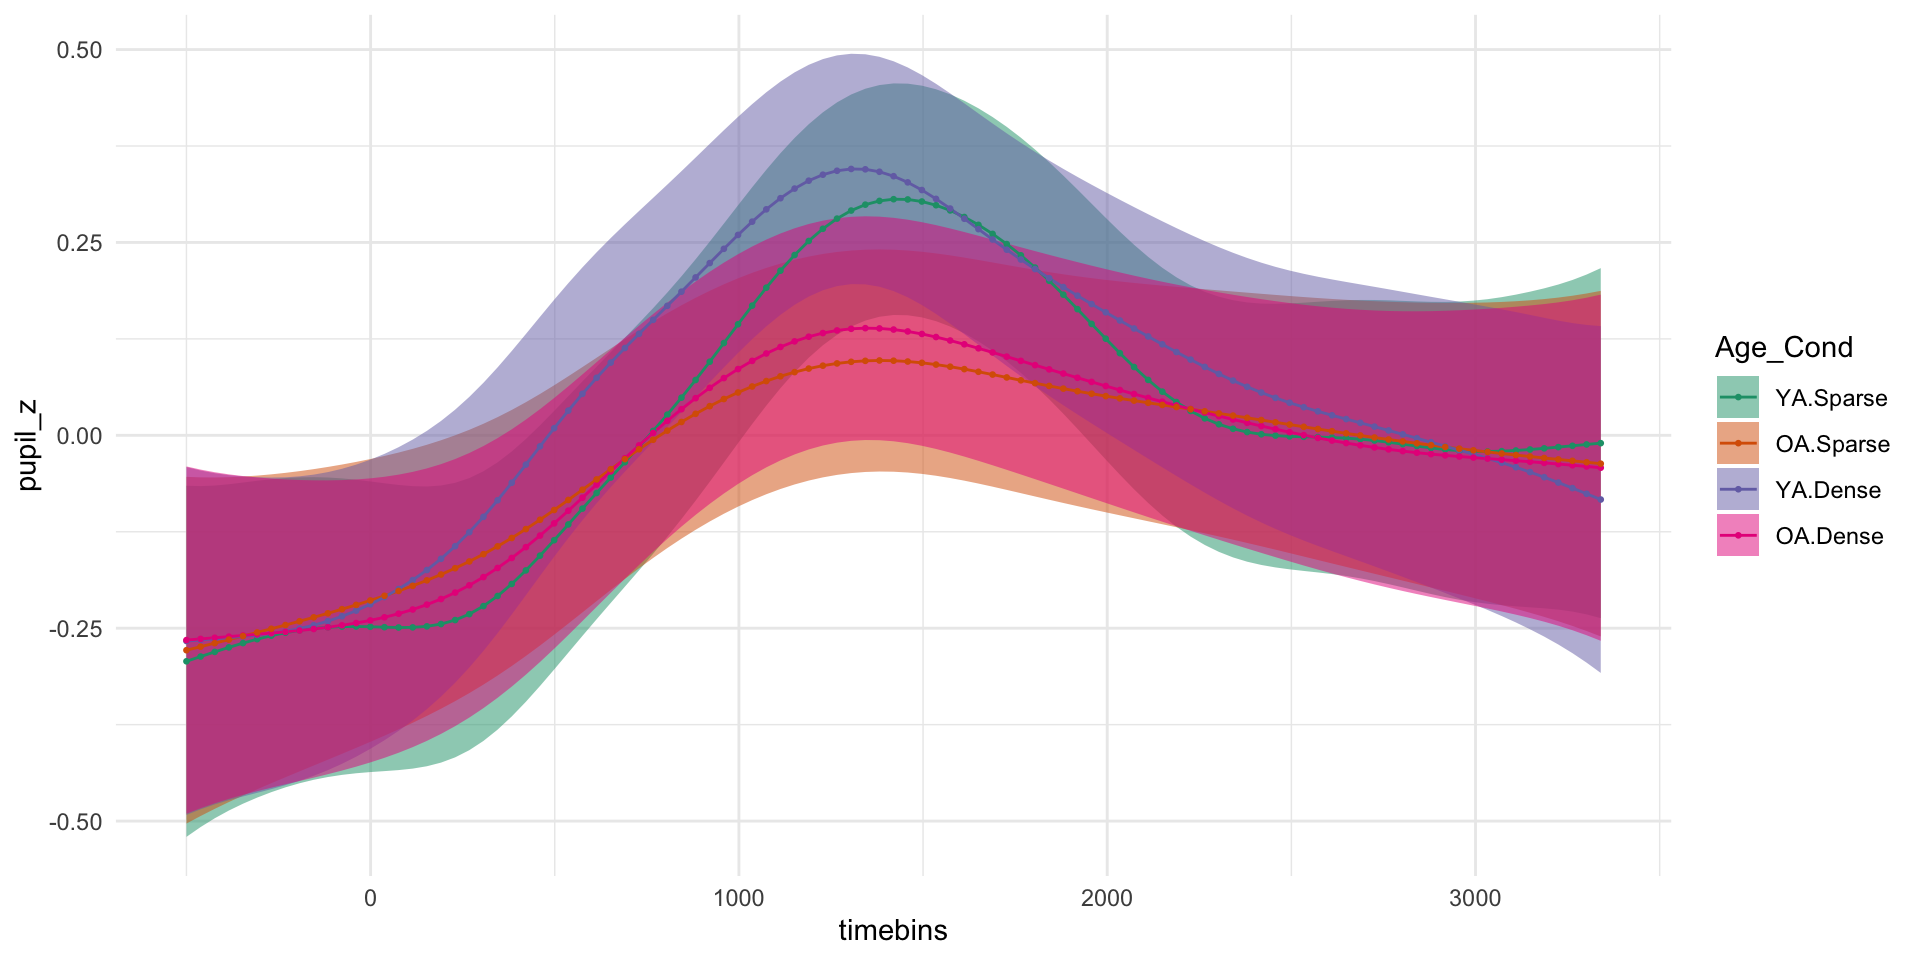
  plot(series = "timebins", comparison = "Age_Cond")

Separate Age_Cond

pdq_gam_5_pred_2 <- predict_gam(
  pdq_gam_5, length_out = 100, exclude_terms = "s(timebins,subject)",
  values = c(subject = "1"),
  separate = list(Age_Cond = c("Age", "Condition"))
) %>%
  # The separate arguments returns variables with default alphabetical order.
  # Let's reorder the levels in Condition and Age.
  mutate(
    Condition = factor(Condition, levels = c("Sparse", "Dense")),
    Age = factor(Age, levels = c("YA", "OA")),
  )

Plot predictions by Condition for each Age group

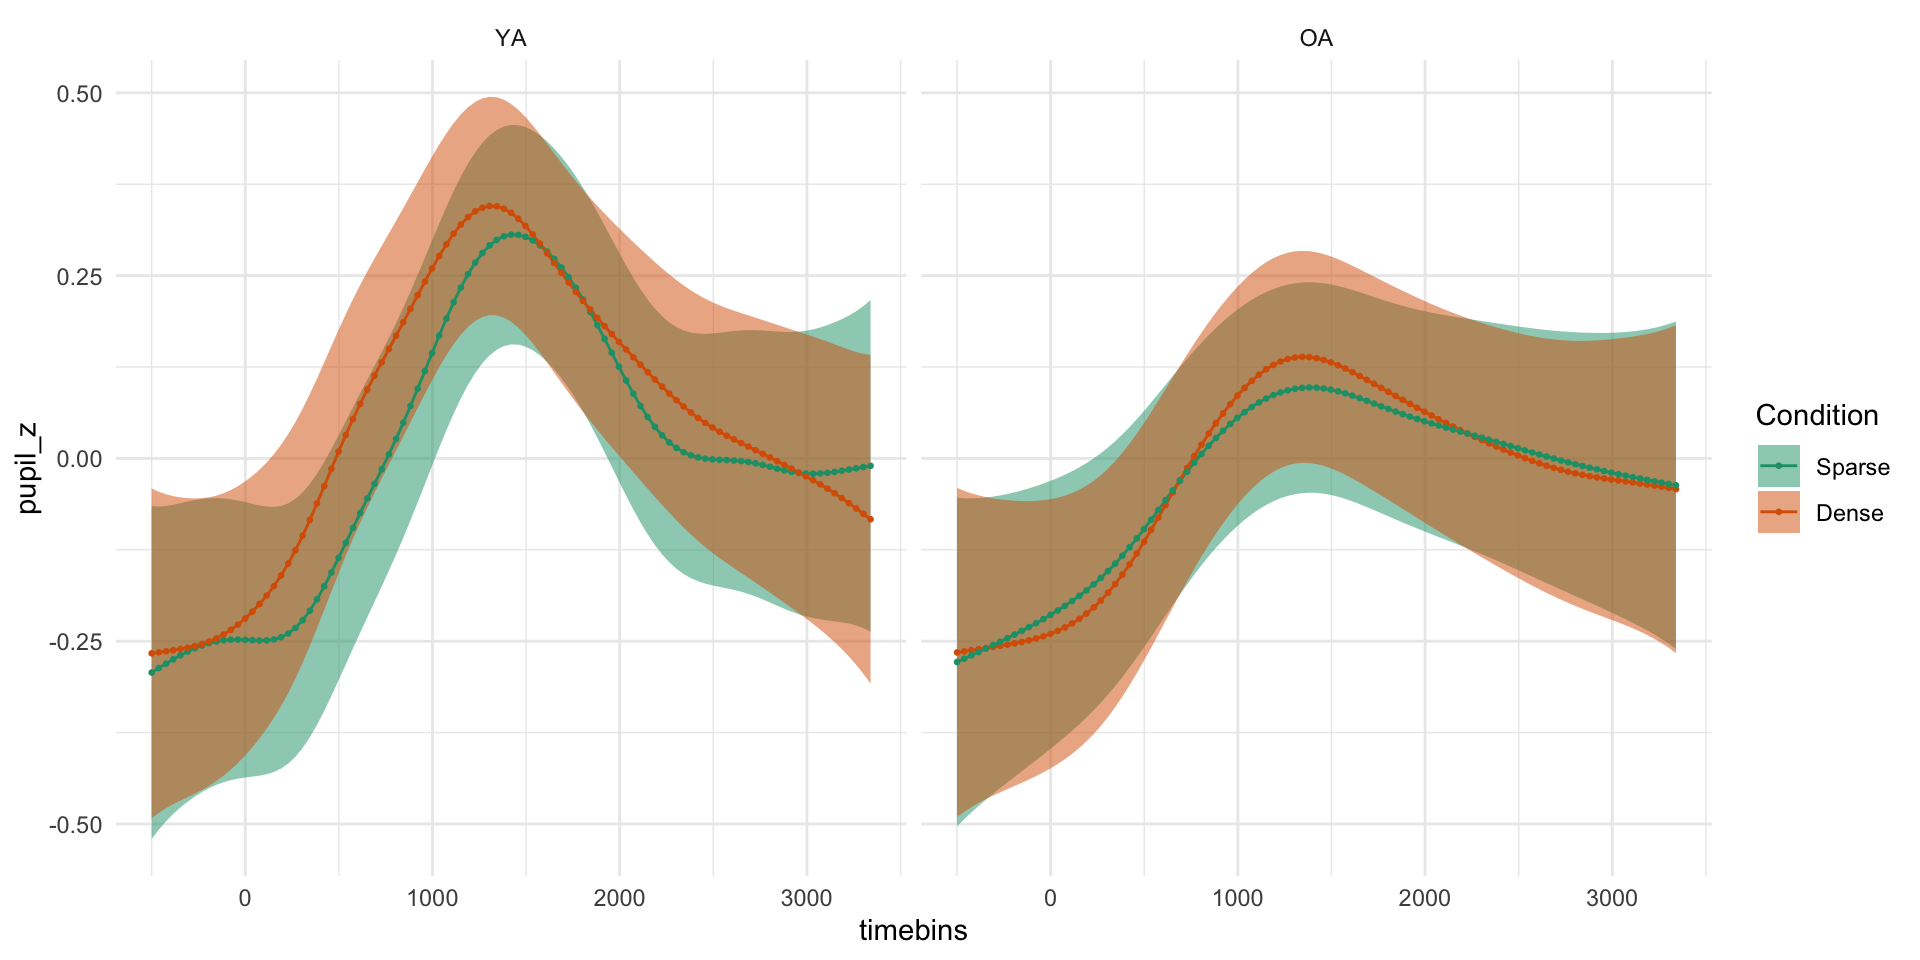
pdq_gam_5_pred_2 %>% plot(series = "timebins", comparison = "Condition") + facet_grid(~ Age)

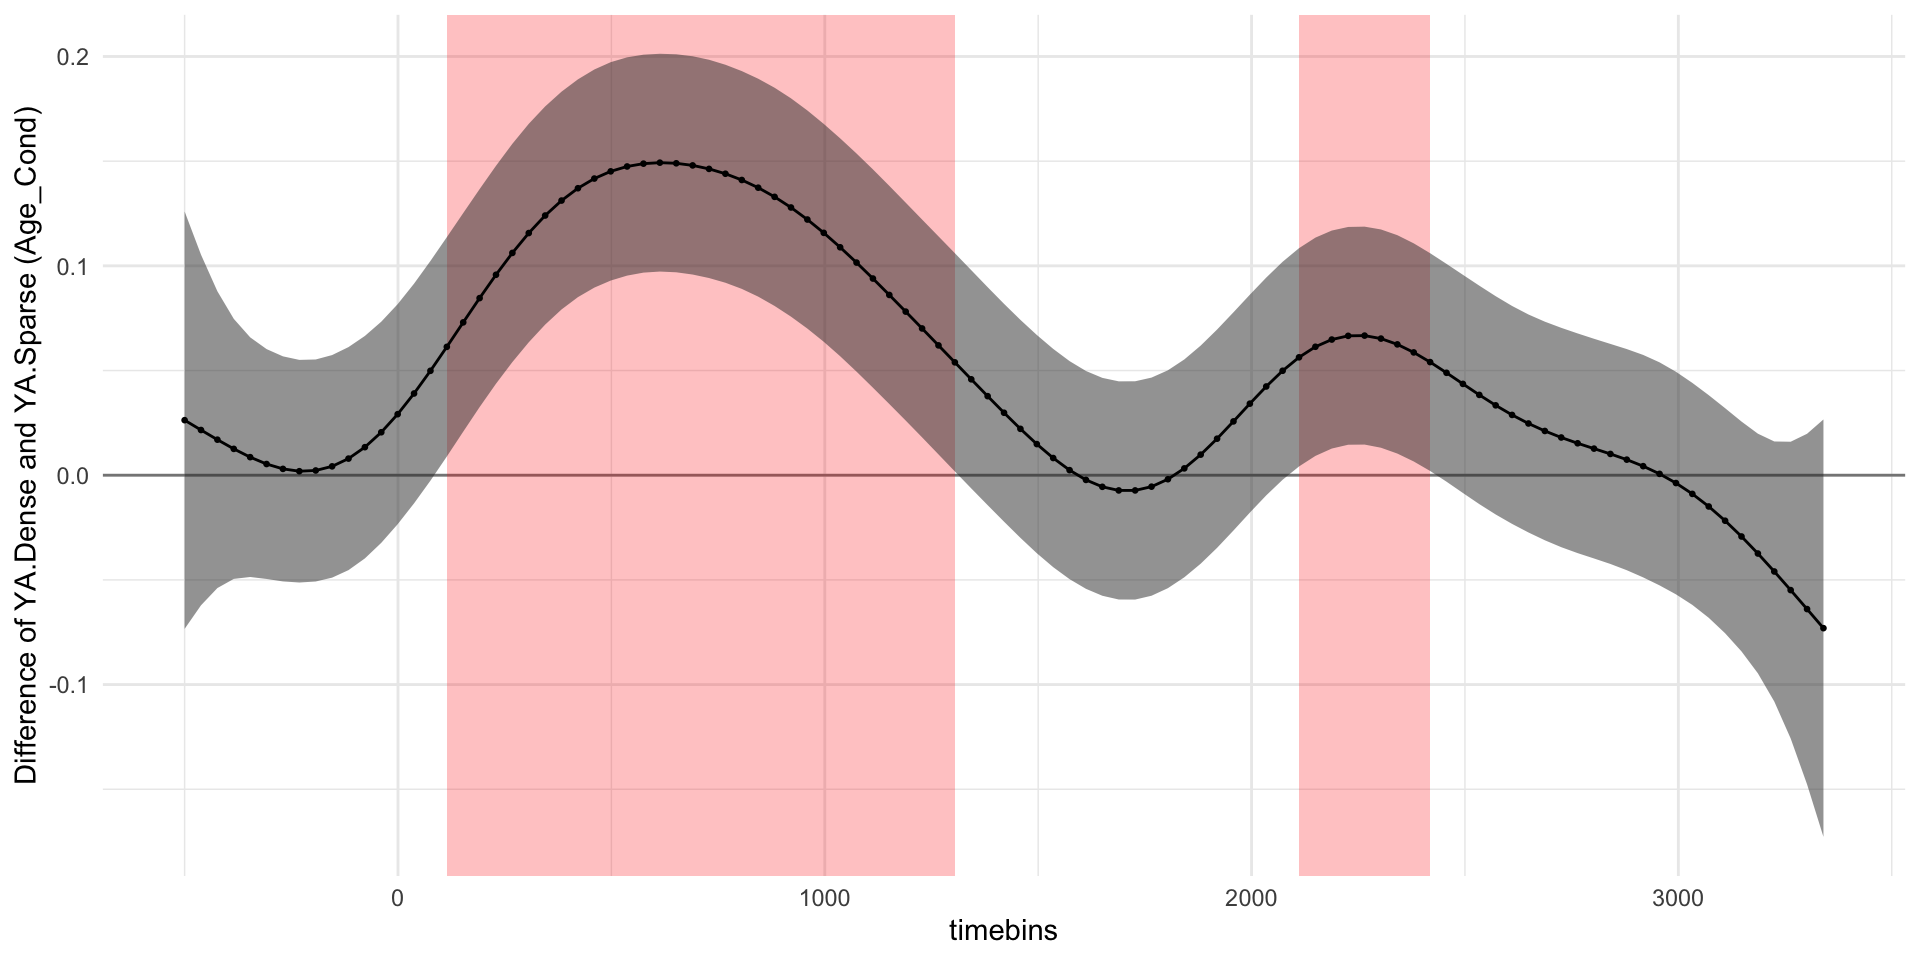
Get difference in Age = YA

pdq_gam_5_diff <- get_difference(
  pdq_gam_5, series = "timebins", length_out = 100, exclude_terms = "s(timebins,subject)",
  compare = list(Age_Cond = c("YA.Dense", "YA.Sparse"))
)

Plot difference in Age = YA

pdq_gam_5_diff %>% plot()

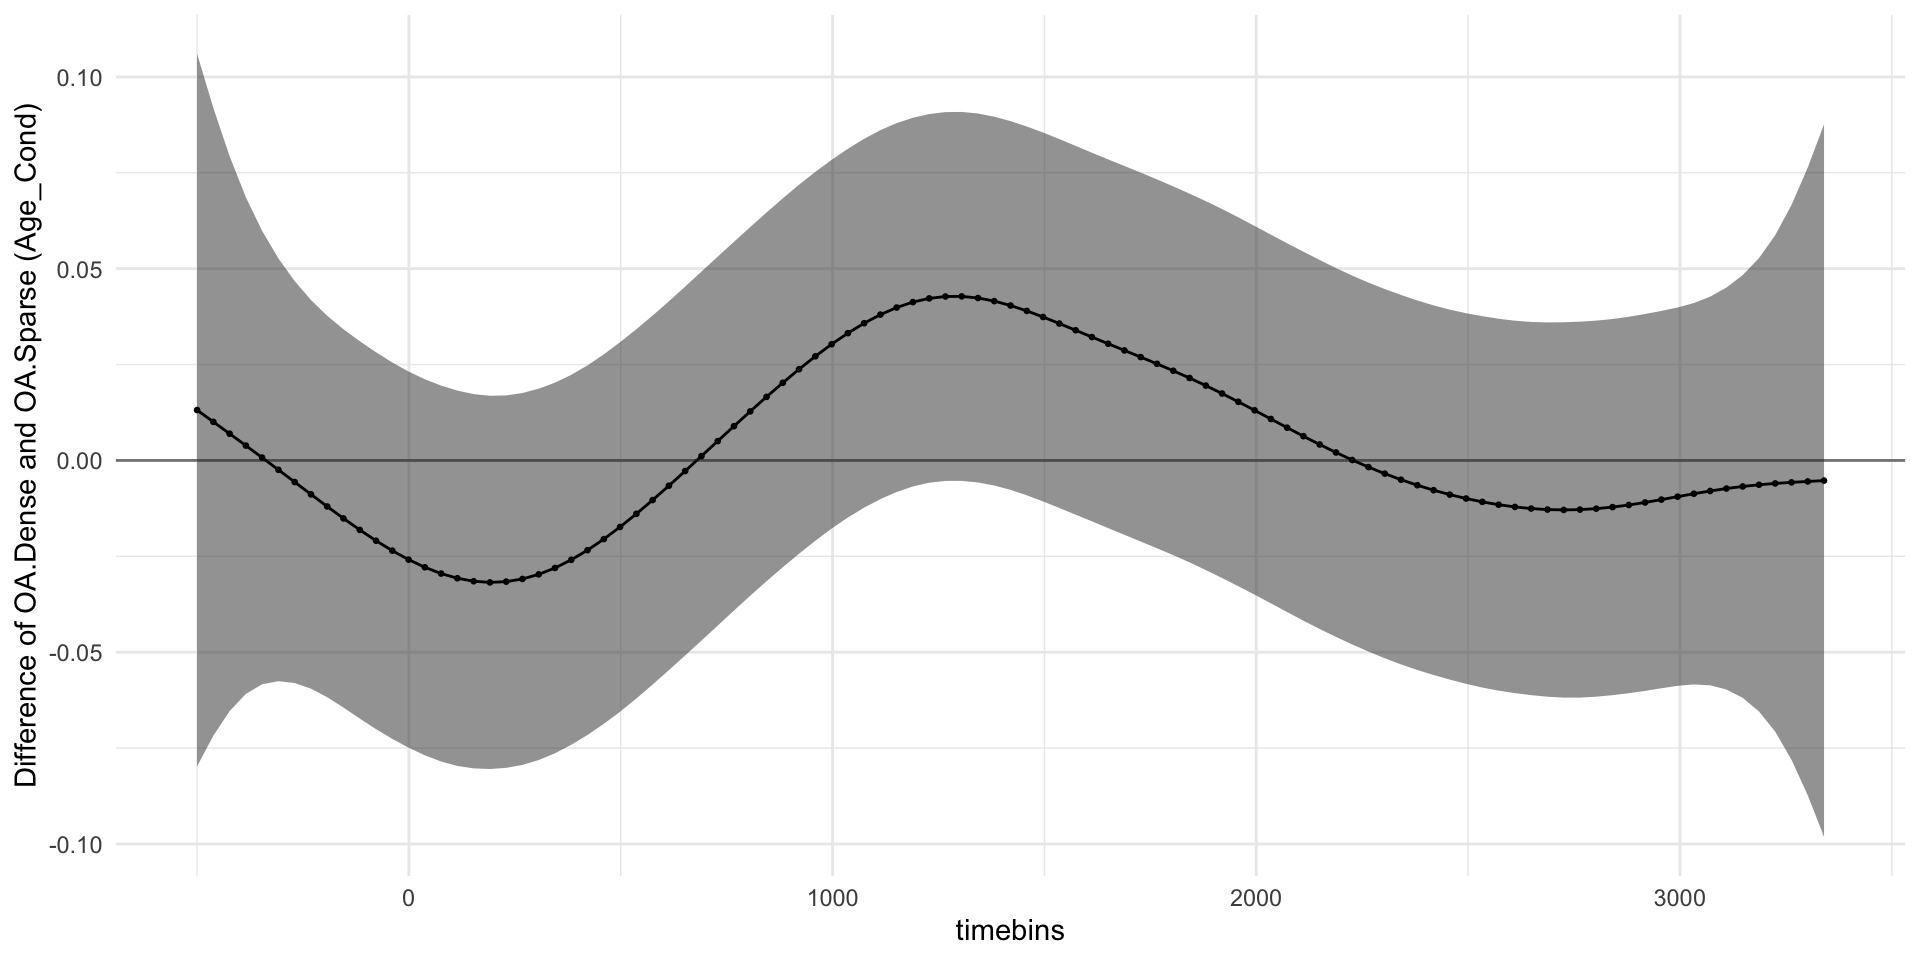
Get difference in Age = OA

pdq_gam_5_diff_2 <- get_difference(
  pdq_gam_5, series = "timebins", length_out = 100, exclude_terms = "s(timebins,subject)",
  compare = list(Age_Cond = c("OA.Dense", "OA.Sparse"))
)

Plot difference in Age = OA

pdq_gam_5_diff_2 %>% plot()