Introduction to Bayesian Linear Models

03 - Priors

Stefano Coretta

University of Edinburgh

Bayesian belief update

Let’s start small

\[\text{RT}_i \sim Gaussian(\mu, \sigma)\]

  • \(\text{RT}_i\): Reaction Times

  • \(\sim\): distributed according to a

  • \(Gaussian()\): Gaussian distribution

  • with mean \(\mu\) and standard deviation \(\sigma\)

We assume RTs are distributed according to a Gaussian distribution (the assumption can be wrong)

…and in fact it is (RTs are not Gaussian, but we will get to that later).

The empirical rule

The empirical rule

The empirical rule

The empirical rule

The empirical rule

Distribution of RTs

\[\text{RT}_i \sim Gaussian(\mu, \sigma)\]


Pick a \(\mu\) and \(\sigma\).

Report them here: https://forms.gle/M7juHsxyv5Vbs7Gx7.

Let’s see what we got!

Distribution of RTs

\[\text{RT}_i \sim Gaussian(\mu, \sigma)\]

\[\mu = ...?\]

\[\sigma = ...?\]

When uncertain, use probabilities!

Priors of the parameters

\[ \begin{align} \text{RT}_i & \sim Gaussian(\mu, \sigma)\\ \mu & \sim Gaussian(\mu_1, \sigma_1)\\ \sigma & \sim Cauchy_{+}(0, \sigma_2)\\ \end{align} \]

Let’s pick \(\mu_1\) and \(\sigma_1\).

We can use the empirical rule.

Prior for \(\mu\)

\[ \begin{align} \text{RT}_i & \sim Gaussian(\mu, \sigma)\\ \mu & \sim Gaussian(\mu_1, \sigma_1)\\ \sigma & \sim Cauchy_{+}(0, \sigma_2)\\ \end{align} \]

  • Let’s say that the mean is between 500 and 2500 ms at 95% confidence.

  • Get \(\mu_1\)

    • mean(c(500, 2500)) = 1500
  • Get \(\sigma_1\)

    • (2500 - 1500) / 2 = 500

Prior for \(\mu\)

\[ \begin{align} \text{RT}_i & \sim Gaussian(\mu, \sigma)\\ \mu & \sim Gaussian(\mu_1 = 1500, \sigma_1 = 500)\\ \sigma & \sim Cauchy_{+}(0, \sigma_2)\\ \end{align} \]

Prior for \(\mu\): plot

ggplot(tibble(x = c(-100, 3100)), aes(x = x)) +
  stat_function(fun = dnorm, geom = "area", fill = "lightblue",
                args = list(1500, 500))

Prior for \(\sigma\)

# library(HDInterval)

round(inverseCDF(c(0.025, 0.5, 0.975), ptrunc, spec = "cauchy", a = 0, scale = 10))
[1]   0  10 255
round(inverseCDF(c(0.025, 0.5, 0.975), ptrunc, spec = "cauchy", a = 0, scale = 25))
[1]   1  25 636
round(inverseCDF(c(0.025, 0.5, 0.975), ptrunc, spec = "cauchy", a = 0, scale = 50))
[1]    2   50 1273

Prior for \(\sigma\): plot

ggplot(tibble(x = c(0, 500)), aes(x = x)) +
  stat_function(fun = dcauchy, geom = "area", fill = "tomato4",
                args = list(0, 25))

Prior predictive checks: sample prior

brm_3_priorpp <- brm(
  RT ~ 1,
  family = gaussian,
  prior = c(
    prior(normal(1500, 500), class = Intercept),
    prior(cauchy(0, 25), class = sigma)
  ),
  data = mald,
  sample_prior = "only",
  cores = 4,
  file = "data/cache/brm_3_priorpp",
  seed = my_seed
)

Prior predictive checks: sample prior

summary(brm_3_priorpp)
 Family: gaussian 
  Links: mu = identity; sigma = identity 
Formula: RT ~ 1 
   Data: mald (Number of observations: 3000) 
  Draws: 4 chains, each with iter = 2000; warmup = 1000; thin = 1;
         total post-warmup draws = 4000

Regression Coefficients:
          Estimate Est.Error l-95% CI u-95% CI Rhat Bulk_ESS Tail_ESS
Intercept  1505.95    489.24   536.86  2446.34 1.00     2753     2363

Further Distributional Parameters:
      Estimate Est.Error l-95% CI u-95% CI Rhat Bulk_ESS Tail_ESS
sigma   270.58   5598.05     0.99   845.19 1.00     2921     2014

Draws were sampled using sampling(NUTS). For each parameter, Bulk_ESS
and Tail_ESS are effective sample size measures, and Rhat is the potential
scale reduction factor on split chains (at convergence, Rhat = 1).

Prior predictive checks: plot

set.seed(my_seed)
brm_3_pppreds <- posterior_predict(brm_3_priorpp, newdata = tibble(y = 1), ndraws = 1e3) |>
  as.vector()

ggplot() +
  aes(x = brm_3_pppreds) +
  geom_density(fill = "forestgreen") +
  geom_rug()

Prior predictive checks: plot (zoom in)

ggplot() +
  aes(x = brm_3_pppreds) +
  geom_density(fill = "forestgreen") +
  xlim(-1000, 3500) +
  geom_rug()

Run the model

brm_3 <- brm(
  RT ~ 1,
  family = gaussian,
  prior = c(
    prior(normal(1500, 500), class = Intercept),
    prior(cauchy(0, 25), class = sigma)
  ),
  data = mald,
  cores = 4,
  file = "data/cache/brm_3",
  seed = my_seed
)

Model summary

summary(brm_3)
 Family: gaussian 
  Links: mu = identity; sigma = identity 
Formula: RT ~ 1 
   Data: mald (Number of observations: 3000) 
  Draws: 4 chains, each with iter = 2000; warmup = 1000; thin = 1;
         total post-warmup draws = 4000

Regression Coefficients:
          Estimate Est.Error l-95% CI u-95% CI Rhat Bulk_ESS Tail_ESS
Intercept  1046.60      6.34  1034.32  1058.94 1.00     3563     2804

Further Distributional Parameters:
      Estimate Est.Error l-95% CI u-95% CI Rhat Bulk_ESS Tail_ESS
sigma   347.51      4.45   338.90   356.76 1.00     3678     2772

Draws were sampled using sampling(NUTS). For each parameter, Bulk_ESS
and Tail_ESS are effective sample size measures, and Rhat is the potential
scale reduction factor on split chains (at convergence, Rhat = 1).

Posterior predictive checks

pp_check(brm_3, ndraws = 100)

Summary

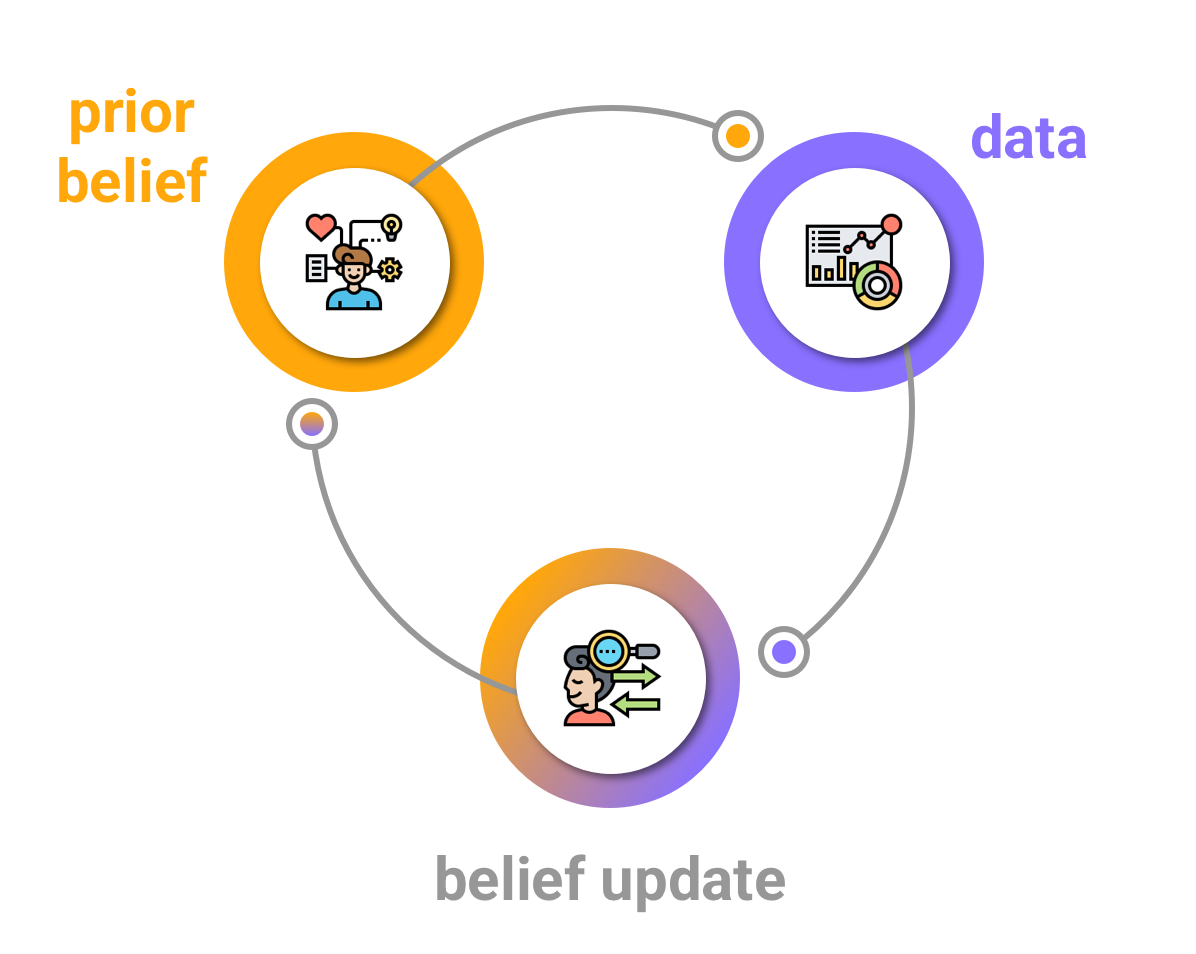
  • Priors are probability distributions that convey prior knowledge about the model parameters.

  • Gaussian family

    • \(\mu\): Gaussian prior.
    • \(\sigma\): (Truncated) Cauchy prior (but also Student-t and others).
  • Use the empirical rule to work out Gaussian priors and the HDIinterval::inverseCDF() function for other families.

  • Prior predictive checks are fundamental and should be run during the study design, before data collection (or in any case without being informed by the data).