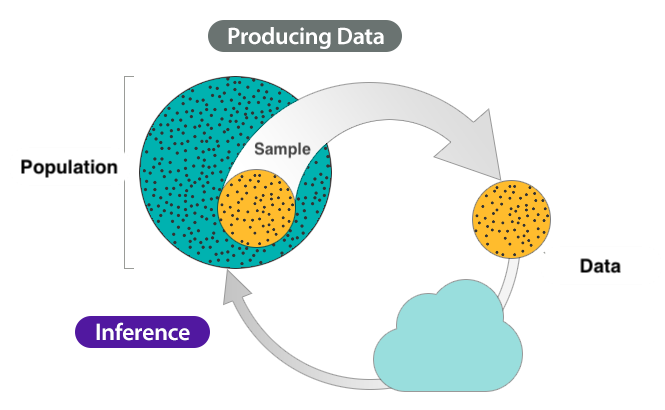
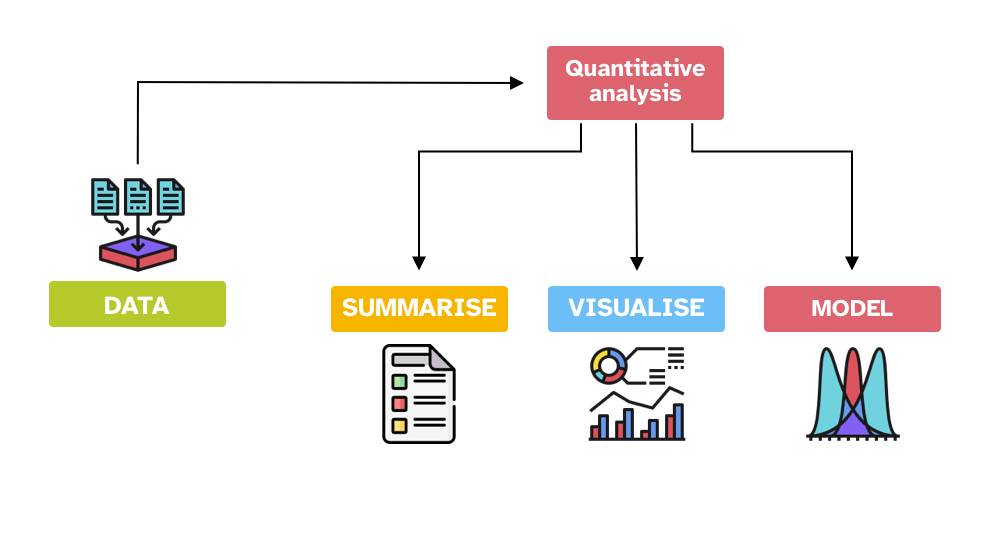
class: center, middle, inverse, title-slide .title[ # Bayesian Linear Models ] .subtitle[ ## 01 - Introduction ] .author[ ### Stefano Coretta ] .institute[ ### University of Edinburgh ] .date[ ### 2023/07/07 ] --- class: inverse right middle .f2[The numbers have no way of speaking for themselves. We speak for them. We imbue them with meaning.] — Nate Silver, *The Signal and the Noise* --- ## Inference process .center[  ] ??? We take a **sample** from the population. This is our empirical data (the product of observation). How do we go from data/observation to answering our question? We can use **inference**. **Inference** is the process of understanding something about a population based on the sample (aka the data) taken from that population. --- class: middle center inverse ## Inference is not infallible ??? However, inference based on data does not guarantee that the answers to our questions are right/true. In fact, any observation we make comes with a degree of **uncertainty and variability**. EXTRA: Check out this article: <https://www.scientificamerican.com/article/if-you-say-science-is-right-youre-wrong/> EXTRA: Find out about Popper's view of falsification and fallibilism. --- ## Uncertainty and variability .center[  ] ??? So we have to deal with: - Uncertainty in any observation of a phenomenon. - Variability among different observations of the same phenomenon. --- class: center, middle, inverse  ??? Guess what it is... --- class: center middle inverse ## *Statistics* as a tool to deal with *uncertainty* and *variability* ??? Statistics helps us quantifying uncertainty and accounting for variability. --- ## Statistics .center[  ] --- ## Statistical model .bg-washed-blue.b--dark-blue.ba.bw2.br3.shadow-5.ph4.mt2[ A **statistical model** is a mathematical model that represents the relationship between variables in the data. ] -- <br> > All models are wrong, but some are useful. —[George Box](https://en.wikipedia.org/wiki/All_models_are_wrong) --- layout: true ## The MALD dataset --- [Massive Auditory Lexical Decision](https://aphl.artsrn.ualberta.ca/?page_id=827) (Tucker et al. 2019): - **MALD data set**: 521 subjects, RTs and accuracy. - Subset of MALD: 30 subjects, 100 observations each. - Let's investigate the effect of *mean phone-level Levenshtein distance* and *lexical status* (word vs non-word). -- ```r mald ``` ``` ## # A tibble: 3,000 × 7 ## Subject Item IsWord PhonLev RT ACC RT_log ## <chr> <chr> <fct> <dbl> <int> <fct> <dbl> ## 1 15345 nihnaxr FALSE 5.84 945 correct 6.85 ## 2 15345 skaep FALSE 6.03 1046 incorrect 6.95 ## 3 15345 grandparents TRUE 10.3 797 correct 6.68 ## 4 15345 sehs FALSE 5.88 2134 correct 7.67 ## 5 15345 cousin TRUE 5.78 597 correct 6.39 ## 6 15345 blowup TRUE 6.03 716 correct 6.57 ## 7 15345 hhehrnzmaxn FALSE 7.30 1985 correct 7.59 ## 8 15345 mantic TRUE 6.21 1591 correct 7.37 ## 9 15345 notable TRUE 6.82 620 correct 6.43 ## 10 15345 prowthihviht FALSE 7.68 1205 correct 7.09 ## # ℹ 2,990 more rows ``` --- <img src="index_files/figure-html/rt-1-1.png" height="500px" style="display: block; margin: auto;" /> --- <img src="index_files/figure-html/rt-2-1.png" height="500px" style="display: block; margin: auto;" /> --- <img src="index_files/figure-html/rt-3-1.png" height="500px" style="display: block; margin: auto;" /> --- layout: true ## Probabilities --- .bg-washed-blue.b--dark-blue.ba.bw2.br3.shadow-5.ph4.mt2[ **Probability** - Probability of an **event occurring** or of a **variable taking on a specific value**. - Probabilities can only be **between 0 and 1**. - ⛔️ 0 means **impossible**. - 🤷 0.5 means **it can happen but it can also not happen**. - ✅ 1 means **certain**. ] -- .center[  ] --- .bg-washed-blue.b--dark-blue.ba.bw2.br3.shadow-5.ph4.mt2[ **Probability** - Probability of an event occurring: 0 to 100% probability. - **Probability of a variable taking on a specific value**: a bit more complicated... ] .bg-washed-green.b--dark-green.ba.bw2.br3.shadow-5.ph4.mt2[ **We need probability distributions!** ] --- layout: false layout: true ## Probability distributions --- <br>  --- .bg-washed-blue.b--dark-blue.ba.bw2.br3.shadow-5.ph4.mt2[ A **probability distribution** is a mathematical function that describes *how the probabilities are distributed over the values* that a variable can take on. ] -- .bg-washed-blue.b--dark-blue.ba.bw2.br3.shadow-5.ph4.mt2[ Two types of probability distributions - **Discrete probability distributions.** - **Continuous probability distributions.** ] -- .bg-washed-green.b--dark-green.ba.bw2.br3.shadow-5.ph4.mt2[ Discrete variables follow discrete probability distributions and continuous variables follow continuous probability distributions. ] --- .bg-washed-blue.b--dark-blue.ba.bw2.br3.shadow-5.ph4.mt2[ We can **visualise probability distributions**: - Using the **probability mass function** for discrete probability distributions. - Using the **probability density function** for continuous probability distributions. ] -- .bg-washed-green.b--dark-green.ba.bw2.br3.shadow-5.ph4.mt2[ You don't need to understand the math behind this, but you are free to learn about it through the internet search engine of your choice! ] --- **Probability Density Function** <img src="index_files/figure-html/rt-dens-1.png" height="500px" style="display: block; margin: auto;" /> --- .bg-washed-blue.b--dark-blue.ba.bw2.br3.shadow-5.ph4.mt2[ **Probability distributions can be expressed using parameters.** - We can summarise a probability distribution by specifying the **parameters' values**. - Different types of probability distributions have a different number of parameters and different parameters. ] -- .bg-washed-green.b--dark-green.ba.bw2.br3.shadow-5.ph4.mt2[ The **Gaussian probability distribution** is a continuous probability distribution and it has two parameters: - The mean `\(\mu\)`. - The standard deviation `\(\sigma\)`. ] Go to **[Seeing Theory](https://seeing-theory.brown.edu/probability-distributions/index.html#section2)**. ??? Seeing Theory was created by Daniel Kunin while an undergraduate at Brown University. The goal of this website is to make statistics more accessible through interactive visualizations (designed using Mike Bostock’s JavaScript library D3.js). <https://seeing-theory.brown.edu/index.html#3rdPage> --- <img src="index_files/figure-html/rt-dist-2-1.png" height="500px" style="display: block; margin: auto;" /> --- <img src="index_files/figure-html/rt-dist-2-2-1.png" height="500px" style="display: block; margin: auto;" />